
GFP Antibody, Goat, Polyclonal
Catalog Number:
ROC-600-101-215
- Images (31)

| Article Name: | GFP Antibody, Goat, Polyclonal |
| Biozol Catalog Number: | ROC-600-101-215 |
| Supplier Catalog Number: | 600-101-215 |
| Alternative Catalog Number: | ROC-600-101-215 |
| Manufacturer: | Rockland Immunochemicals |
| Host: | Goat |
| Category: | Antikörper |
| Application: | ELISA, IF, WB |
| Species Reactivity: | Other |
| Immunogen: | The immunogen is a Green Fluorescent Protein (GFP) fusion protein corresponding to the full length amino acid sequence (246aa) derived from the jellyfish Aequorea victoria. |
| Conjugation: | Unconjugated |
| Alternative Names: | goat anti-GFP Antibody, GFP, Green Fluorescent Protein, GFP antibody, Green Fluorescent Protein antibody, EGFP, enhanced Green Fluorescent Protein, Aequorea victoria, Jellyfish |
| Application Dilute: | ELISA: 1:10,000 - 1:30,000, Flow Cytometry: User Optimized, IHC: 1:200 - 1:1,000, IF Microscopy: 1:500, IP: User Optimized, WB: 1:1,000 - 1:10,000 |
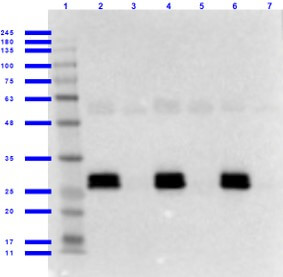
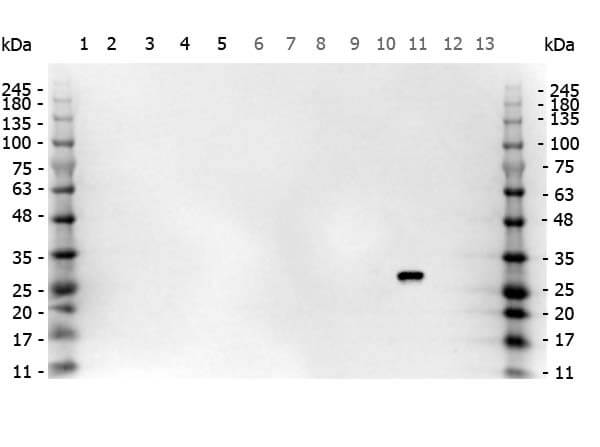
| Application Notes: | Anti-GFP is designed to detect GFP and its variants. Goat Anti-GFP has been tested by ELISA, Western blot, and immunofluorescence. This product is also suitable for EM, FC, FISH, IHC, IP, purification, and multiplex assays based on published references. |
|
|
|
|
|
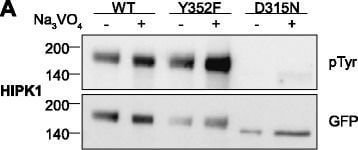
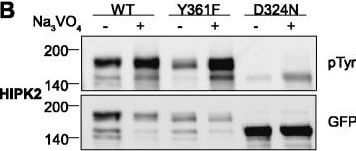
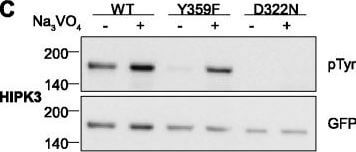
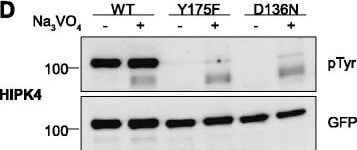
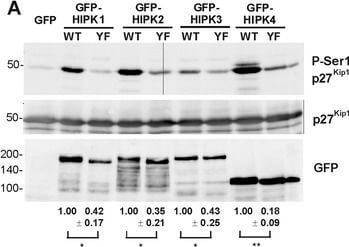
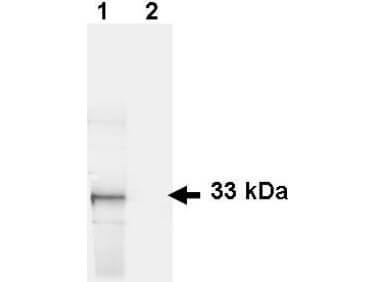
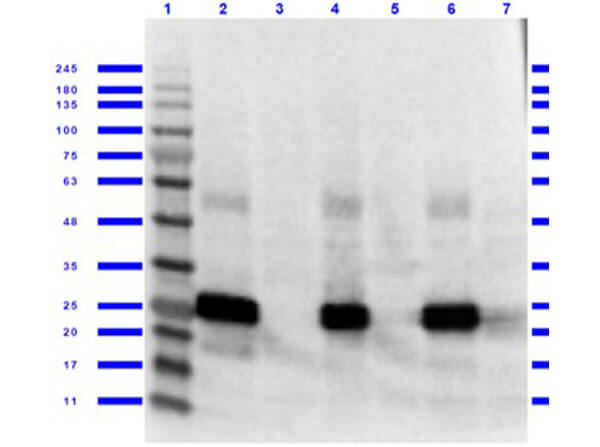
Tyrosine phosphorylation of HIPK mutants. HeLa cells were transiently transfected with the indicated expression constructs for HIPK1 (A), HIPK2 (B), HIPK3 (C) or HIPK4 (D). Sodium orthovanadate (Na3VO4) was added to every second sample for 1 h before lysis. GFP fusion proteins were immunoprecipitated and analysed by immunodetection with antibodies for pTyr and GFP. The panels are representative of 2-3 independent experiments. Figure provided by CiteAb. Source: Cell Commun Signal, PMID: 25630557. |
|
|
|
|
|
|
|
|
|
|
|
|
|
|
|
|
|
Tyrosine phosphorylation of HIPK mutants. HeLa cells were transiently transfected with the indicated expression constructs for HIPK1 (A), HIPK2 (B), HIPK3 (C) or HIPK4 (D). Sodium orthovanadate (Na3VO4) was added to every second sample for 1 h before lysis. GFP fusion proteins were immunoprecipitated and analysed by immunodetection with antibodies for pTyr and GFP. The panels are representative of 2-3 independent experiments. Figure provided by CiteAb. Source: Cell Commun Signal, PMID: 25630557. |
|
|
|
|
|
|
|
|
|
|
|
|
|
|
Maximal activity of HIPKs depends on the activation loop tyrosine. Wild type GFP-HIPK fusion proteins and the respective TyrPhe mutants were immunoprecipitated from HeLa cells and subjected to kinase assays with recombinant GST-p27Kip1(A), myelin basic protein (B) or DYRKtide (C). GFP served as background control. A, Phosphorylation of p27Kip1 at Ser10 was detected by immunoblotting with a phosphorylation-specific antibody. For quantitative evaluation, pSer10 immunoreactivity was normalised to GFP immunoreactivity, which reflects the amount of kinase in the reaction. The blots illustrate a representative experiment, and the relative catalytic activities as determined from 3-4 assays are shown below the panels (means SD). One-sample t test: *, p < 0.05, **, p < 0.01. B and C, Phosphorylation of MBP and DYRKtide was measured in triplicate as incorporation of 32P. Background values from the GFP control samples were subtracted and activities were normalised to the amount of kinase in... |
|
|
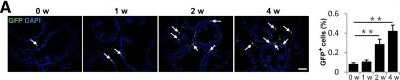
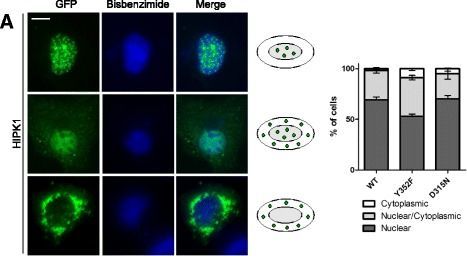
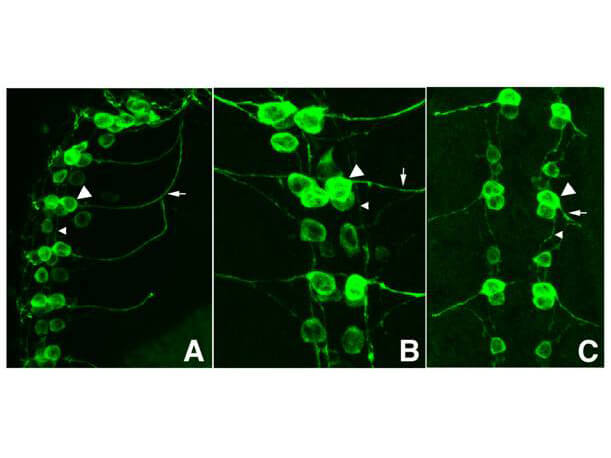
Subcellular distribution of HIPK mutants. COS-7 cells were transfected with expression vectors for GFP-HIPK1 (A), GFP-HIPK2 (B), GFP-HIPK3 (C) or GFP-HIPK4 (D). The cellular localisation of the HIPK constructs was evaluated by imaging GFP autofluorescence in relation to bisbenzimide-stained nuclei. For each kinase, cells were classified into 3 major patterns that are illustrated by representative images and icons. The cells shown were transfected with (top to bottom) HIPK1 WT, DN, YF, HIPK2 WT, WT, YF, HIPK3 WT, WT, DN and HIPK4 DN, DN. A series of images of the different patterns for each kinase and its mutants is provided in the additional material (Additional file 1: Figure S3). Here the graphs show the percentages of cells classified into the indicated patterns (means SD, n = |
|
|
|
|
|
|
|
|
|
|
|
|
|
|
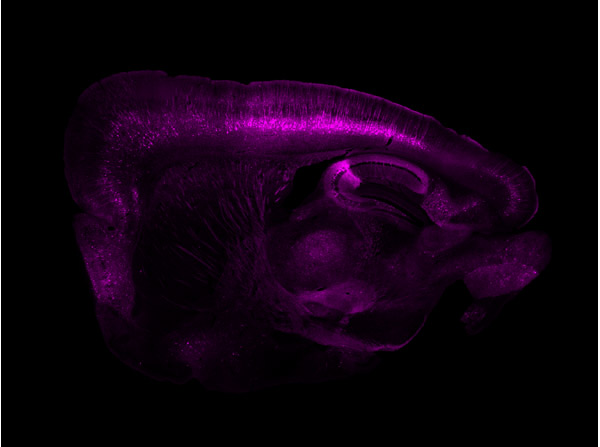
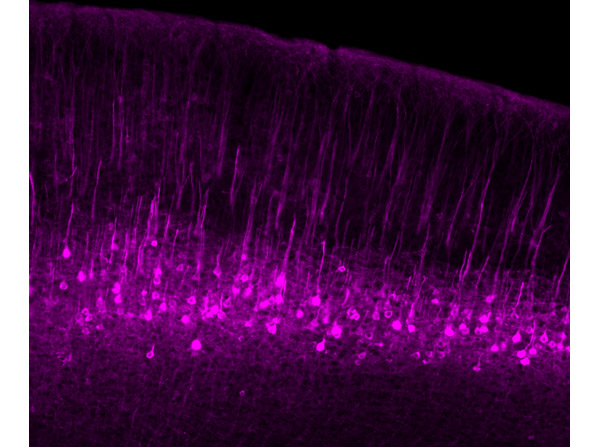
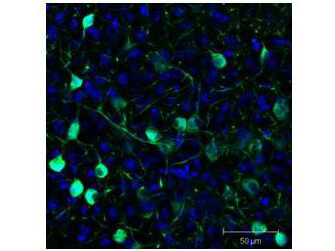
Immunofluorescence results using Goat Anti-GFP Antibody. Staining was performed on free-floating 40µm mouse brain sections. Heat antigen retrieval was performed for 30 minutes at 80C in sodium citrate buffer (pH 8.9). Sections were blocked in 5% donkey serum with 0.25% Triton X-100 for 1h at RT, then incubated overnight at 4C in a 1:1000 dilution of Goat Anti-GFP (p/n 600-101-215). Sections were then washed and incubated for 2h at RT in a 4µg/mL solution of donkey anti-rabbit AF647-conjugated secondary antibody. 10X fluorescence images were obtained using a Zeiss Axioscan automated slide scanning microscope. Low mag. Image courtesy of Michael Castle lab, University of California, San Diego. |
|
|
|
|
|
|
|
|
|
|
|
|
|
|
|
|
|
|
|
|
|
|
|
Product Guarantee and Expert Support
