![]()
|
In vitro comparison of the split-design CAR approach with conventional CAR. a Schematic representations of ligand-based conventional and split-design CAR approaches. The extracellular domains of BAFF and APRIL were used as target moieties to generate conventional CAR-T cells, referred to as APRIL CAR and BAFF CAR, respectively. b , d Representative images of cell‒cell conjugates captured at 100* oil objective magnification using a laser scanning confocal microscope (Nikon, A1R). APRIL or 9E10-IgG4m (pre-incubated with Myc-APRIL) CAR-T cells were co-cultured with RPMI8226-GFP cells ( b ), while BAFF or 9E10-IgG4m (pre-incubated with Myc-BAFF) CAR-T cells were co-cultured with IM9-GFP cells ( d ). Fluorescent labels included Hoechst (blue), anti-PKC-theta (red), and GFP (green) and a merged view of all stains. Scale bar=10µm. c , e Statistical analysis of the mean fluorescence intensity of PKC-theta at the IS in panels b and d, respectively. In panel c, sample sizes: APRIL CAR, n =37, 9E10-IgG4m, n =39. In panel e, BAFF CAR, n =34, 9E10-IgG4m, n =44. All n values represent individual cells. P values were determined by paired two-tailed t -tests. f , g Cytotoxicity assays of conventional and split-design CAR-T cells against the indicated target cells at various E:T ratios for 24h in triplicate. h , i Inflammatory cytokine release assay. Conventional CAR-T cells or sCAR-T cells along with 1nM corresponding switches were co-cultured with the specific target cells for 24h at an E:T ratio of 1:1 in triplicate. Two-way ANOVA multiple comparisons in Dunnett correction were used to assess significance. j , l Schematic representations of ligand-based split-design CAR and FDA-approved CAR, referred to as BCMA CAR ( j ) and CD19 CAR ( l ), respectively. k , m Cytotoxicity assays of FDA-approved CAR-T cells and split-design CAR-T cells against the indicated target cells at various E:T ratios for 24h in triplicate. Data in this figure are representative of three independent experiments. Error bars represent meanSD. NS indicates not significant. Source data are provided in the Source Data file. Index in PubMed under a CC BY license. PMID: 39528513 |
![]()
|
In vivo comparison of the split-design CAR approach with ligand-based conventional CARs. a Timeline of in vivo experiments. Consistent results were obtained in two independent experiments ( n =5 mice). b Rep |
![]()
|
|
![]()
|
Western blot analysis of CD19 using anti-CD19 antibody (M00154). Electrophoresis was performed on a 5-20% SDS-PAGE gel at 70V (Stacking gel) / 90V (Resolving gel) for 2-3 hours. The sample well of each lane was loaded with 30 ug of sample under reducing conditions. Lane 1: human Raji whole cell lysates, Lane 2: human Daudi whole cell lysates, Lane 3: human Ramos whole cell lysates. After electrophoresis, proteins were transferred to a nitrocellulose membrane at 150 mA for 50-90 minutes. Blocked the membrane with 5% non-fat milk/TBS for 1.5 hour at RT. The membrane was incubated with rabbit anti-CD19 antigen affinity purified monoclonal antibody (M00154) at 1:500 overnight at 4C, then washed with TBS-0.1%Tween 3 times with 5 minutes each and probed with a goat anti-rabbit IgG-HRP secondary antibody at a dilution of 1:500 for 1.5 hour at RT. The signal is developed using an Enhanced Chemiluminescent detection (ECL) kit (Catalog EK1002) with Tanon 5200 system. A specific band was detected for CD19 at approximately 95 kDa. The expected band size for CD19 is at 61 kDa. |
![]()
|
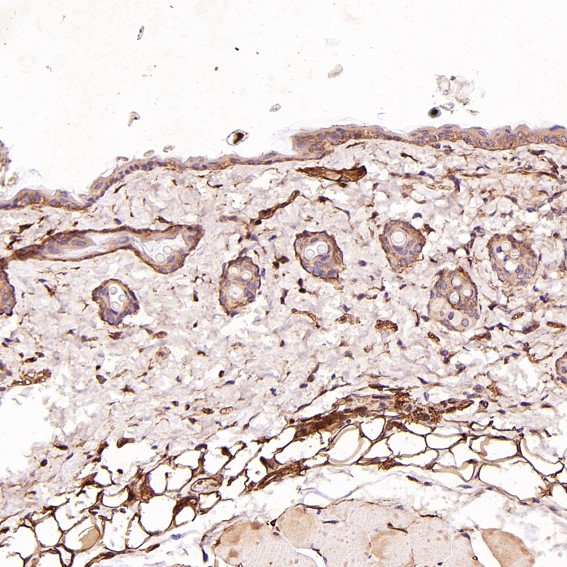
Immunohistochemical analysis of paraffin-embedded Mouse skin, using the Antibody at 1:100 dilution. |
![]()
|
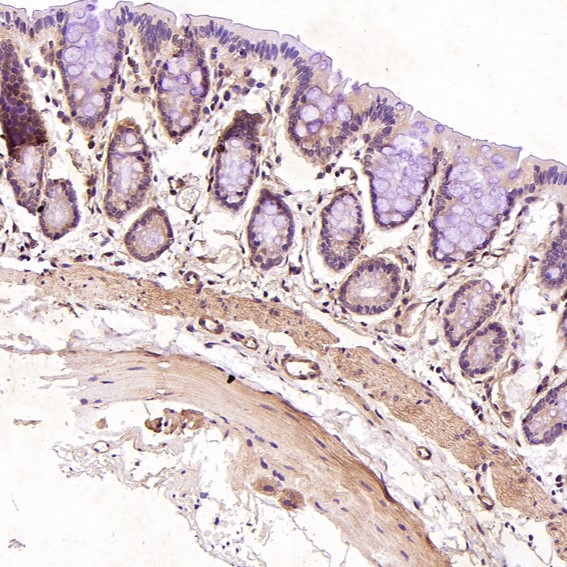
Immunohistochemical analysis of paraffin-embedded Rat stomach, using the Antibody at 1:100 dilution. |
![]()
|
Immunohistochemical analysis of paraffin-embedded Human esophageal carcinoma, using the Antibody at 1:300 dilution. |
![]()
|
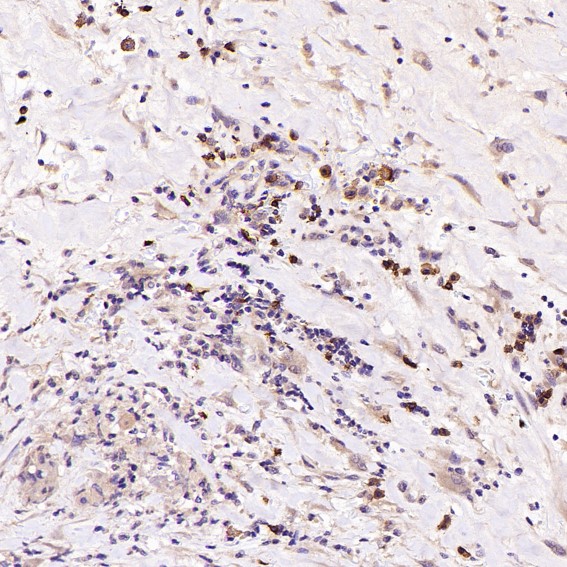
Immunohistochemical analysis of paraffin-embedded Human Hodgkins lymphoma, using the Antibody at 1:1000 dilution. |
![]()
|
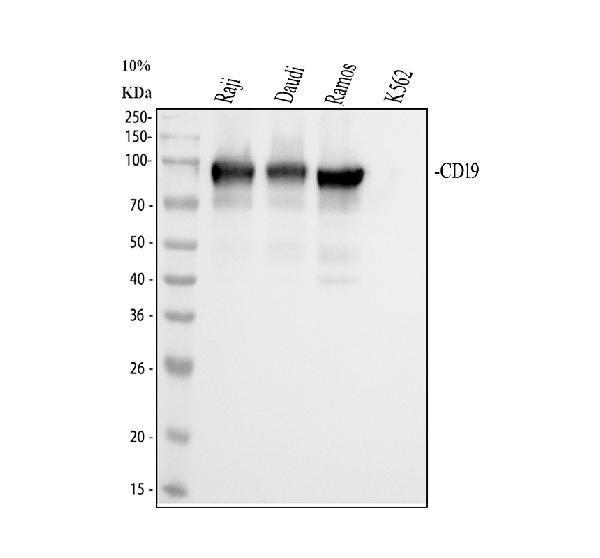
Western blot analysis of CD19 using anti-CD19 antibody (M00154). Electrophoresis was performed on a 10% SDS-PAGE gel at 80V (Stacking gel) / 120V (Resolving gel) for 2 hours. The sample well of each lane was loaded with 30 ug of sample under reducing conditions. Lane 1: human Raji whole cell lysates,Lane 2: human Daudi whole cell lysates,Lane 3: human Ramos whole cell lysates,Lane 4: human K562 whole cell lysates.After electrophoresis, proteins were transferred to a nitrocellulose membrane at 150 mA for 50-90 minutes. Blocked the membrane with 5% non-fat milk/TBS for 1.5 hour at RT. The membrane was incubated with rabbit anti-CD19 antigen affinity purified monoclonal antibody (M00154) at 1:500 overnight at 4C, then washed with TBS-0.1%Tween 3 times with 5 minutes each and probed with a goat anti-rabbit IgG-HRP secondary antibody at a dilution of 1:5000 for 1.5 hour at RT. The signal is developed using an ECL Plus Western Blotting Substrate (Catalog AR1196-200) with Tanon 5200 system. A specific band was detected for CD19 at approximately 95 kDa. The expected band size for CD19 is at 61 kDa. |