
PDL2 Detection Set (Risk Free), IgG1, Unconjugated, Mouse
Artikelnummer:
BYT-ORB1227444
- Bilder (8)


| Artikelname: | PDL2 Detection Set (Risk Free), IgG1, Unconjugated, Mouse |
| Artikelnummer: | BYT-ORB1227444 |
| Hersteller Artikelnummer: | orb1227444 |
| Alternativnummer: | BYT-ORB1227444-1 |
| Hersteller: | Biorbyt |
| Wirt: | Mouse |
| Kategorie: | Antikörper |
| Applikation: | ELISA, FC, ICC, IF, IHC-P, WB |
| Spezies Reaktivität: | Human |
| Immunogen: | Mouse monoclonal PD-L2 antibodies were raised against the extracellular domain of human PD-L2. |
| Konjugation: | Unconjugated |
| PDL2 Detection Set (Risk Free) |
| Konzentration: | Antibody 1 mg/mL |
| Isotyp: | IgG1 |
| Puffer: | PBS containing 0.02% sodium azide. |
| Formulierung: | Liquid |
|
|
Western blot analysis of PD-L2 in overexpressing 293 cells using orb1239853, orb1239856, orb1239859, orb1238786, and orb1239860 antibody at 0.5 and 1 µg/ml, respectively. Larger molecular weight bands represent more highly post-translationally modified PD-L2. |
|
|
Immunocytochemistry of PD-L2 in overexpressing 293 cells using (A) orb1239853, (B) orb1239856, (C) orb1239859, (D) orb1238786, (E) orb1239860, and (F) control mouse IgG antibody at 5 µg/ml. |
|
|
Immunofluorescence of PD-L2 in overexpressing 293 cells using (A) orb1239853, (B) orb1239856, (C) orb1239859, (D) orb1238786, (E) orb1239860, and (F) control mouse IgG antibody at 20 µg/ml. |
|
|
Immunohistochemistry of PD-L2 in human colon carcinoma tissue using (A) orb1239853, (B) orb1239856, (C) orb1239859, (D) orb1238786, (E) orb1239860, and (F) control mouse IgG antibody at 2 µg/ml. |
|
|
Flow cytometry analysis of PD-L2 overexpressing HEK293 cells using (A) orb1239853, (B) orb1239856, (C) orb1239859, (D) orb1238786, (E) orb1239860, and (F) control mouse IgG antibody at 10 µg/ml. Blue: Untransfected HEK293 cells. Yellow: PD-L2 overexpressing HEK293 cells. |
|
|
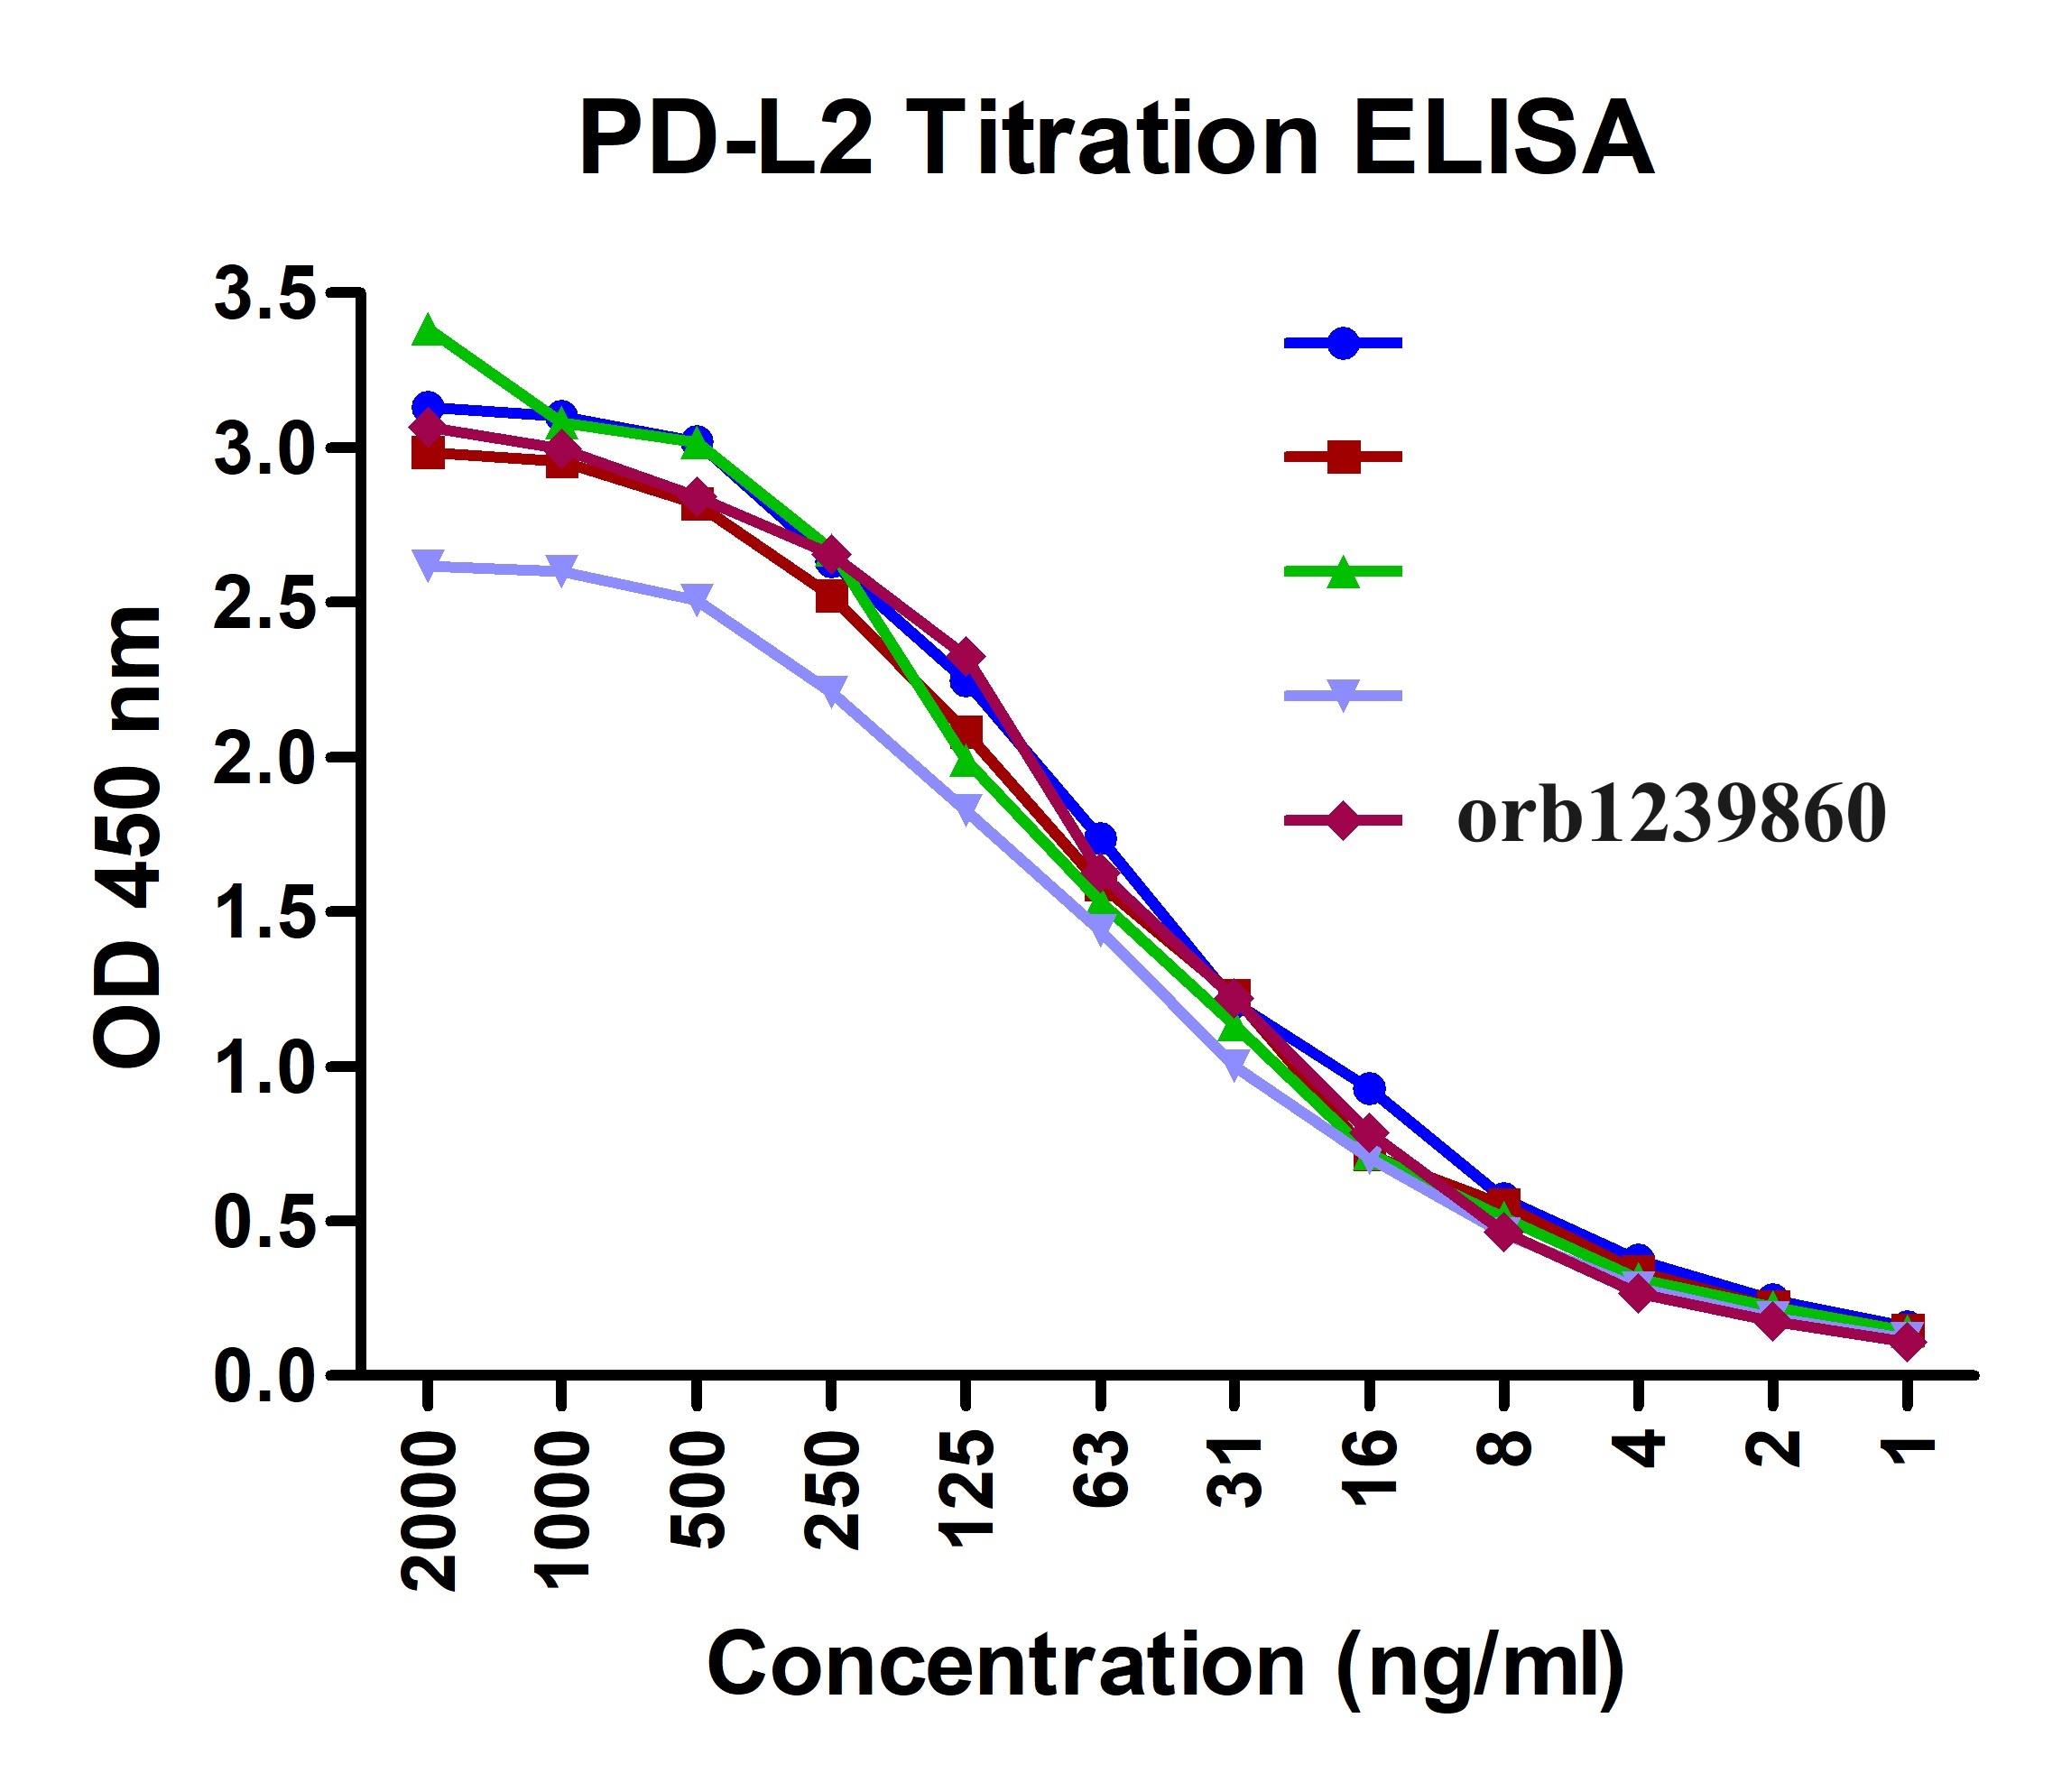
Titration curve analysis of PD-L2 mAbs to detect recombinant PD-L2 in ELISA with orb1239853, orb1239856, orb1239859, orb1238786, and orb1239860 abs at decreasing concentrations. |
|
|
Immunofluorescence of PD-L2 in human tonsil tissue using (A) orb1239853, (B) orb1239856, (C) orb1239859, (D) orb1238786, (E) orb1239860, and (F) control mouse IgG antibody at 20 µg/ml. |
|
|
Immunohistochemistry of PD-L2 in human tonsil tissue using (A) orb1239853, (B) orb1239856, (C) orb1239859, (D) orb1238786, (E) orb1239860, and (F) control mouse IgG antibody at 2 µg/ml. |
Produktgarantie und fachkundiger Support
