Immunoglobulin G from Mouse, IgG from Mouse, purified polyclonal IgG antibody
Mouse IgG
Konzentration:
10.0 mg/mL
Puffer:
Preservative: 0.01% (w/v) Sodium Azide. Stabilizer: None, Buffer: 0.02 M Potassium Phosphate, 0.15 M Sodium Chloride, pH 7.2
Quelle:
Mouse
Reinheit:
Mouse IgG was prepared from normal mouse serum by a multi-step process which includes delipidation, salt fractionation and ion exchange chromatography followed by extensive dialysis against the buffer stated above. Assay by immunoelectrophoresis resulted in a single precipitin arc against anti-Mouse IgG and anti-Mouse Serum.
Formulierung:
Lyophilized
Application Verdünnung:
ELISA: User Optimized, FC: User Optimized, IHC: User Optimized, IP: User Optimized, WB: User Optimized
Anwendungsbeschreibung:
Biological Origin: Mouse. Application Notes: Mouse IgG whole molecule has been tested in SDS-Page and can be utilized as a control or standard reagent in SDS, Western Blotting, and ELISA experiments. Reconstitution Buffer: Restore with deionized water (or equivalent). Reconstitution Volume: 2.5 mL
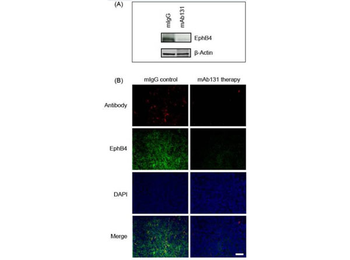
(A) Western blot analysis of EphB4 level in HT29 tumor tissues after mAb131 or mIgG (control) treatment. (B) Antibody and EphB4 co-staining on tumor sections of mAb131 or mIgG (control)-treated HT29 tumor-bearing mice 48 h p.i. of hAb47-Cy5.5. Scale bar, 20 µm. Mouse IgG (mIgG) (p/n orb2652749).
Elav Regulates Dscam1 Long 3 UTR Biogenesis. (E) RIP-qRT-PCR experiments demonstrate binding of Elav downstream of the Dscam1 proximal polyA site (left), and as a positive control, binding of Elav downstream of the Elav proximal polyA site (right). RIP was performed using rat and mouse anti-Elav antibodies from 12-16 h embryos. Primers were designed to detect a region in the CDS or a region immediately downstream of the proximal polyA site (EBS). Error bars represent SEM of four separate immunoprecipitation reactions on independently prepared nuclei. n = 4. p value reflects two-tailed paired Students t test. Samples were incubated with a mixture of 1 µg rat and 1 µg mouse anti-Elav antibodies or a mixture of 1 µg rat and 1 µg mouse IgG,
Epitope-targeting space of top expanded clones. Epitope binning following a classical sandwich protocol: loading of capture antibody, quenching of biosensors in polyclonal mouse IgG (p/n orb2652749), loading of capture antibody, loading of OVA, loading of probe antibody. (A) Heatmaps show competitive antigen binding based on BLI assays for highly expanded antibody clones in each mouse. Antibodies indicated on the left were captured and probe antibodies on top were used to determine cross-competition for epitope access. Red indicates no binding of the probe antibody as a consequence of epitope blocking by the capture antibody, whereas green denotes binding of the competitor antibody. Groups of antibodies that target the same epitope (epitope bins) are highlighted in white squares. Brackets indicate clonal variants that share the same VH/VL germline V-genes which differed only in CDRH3/CDRL3 aa sequence. An anti-RSVF capture antibody, which does not bind the antigen was used as negative control for all experiments. Clone ID according to SI Appendix, Table S1. (B) Epitope bins with associated clones as determined in (A). Nodes are connected based on observed direct cross-competition. (C) Epitope bins as defined by the cross-competition of clones from different mice. Representative V-gene combinations are shown on the right. Nodes are connected based on direct cross-competition and sizes indicate clone size (number of cells per clone). Colors represent mouse ID as shown in (B). Results are reflective of SI Appendix, Fig. S19. (D) CDRH3/CDRL3 sequence alignment of bin-specific clones. Sequence logo is shown on top and aa residues are highlighted if they are in disagreement with the consensus sequence. (E) Mapping of epitope space as determined in (C) on a sequence similarity network of all IgG clones across all mice (SI Appendix, Fig. S12). Edges represent clones with similar CDR3 sequences based on first calculating separate distance matrices for CDRH3 and CDRL3 amino acid sequences. Following the summation of these two matrices, edges were drawn between those clones separated by 700 mapped reads are shown for MS-1 and MS-2 and clone 5.14 of MS-5, for clones 5.12 and 5.29, only data points with > 18 mapped reads are shown. Shared data point between 5.12 and 5.29 is indicated with a circle. Corresponding V-gene combinations are indicated. (H) Mapping of epitope bins from (C) on to the OVA crystal structure using antibody epitope information obtained in (G) (PDB: 1OVA). Epitope binning following a classical sandwich protocol: loading of capture antibody, quenching of biosensors in polyclonal mouse IgG (p/n orb2652749), loading of capture antibody, loading of OVA, loading of probe antibody.
LOTUS binds to p75NTR. A, Binding assay in NgR1-overexpressing Cos-7 cells sequentially treated with s-LOTUS and MAIs. After SBP-Fc-LOTUS (0.1-1 µm) or SBP-Fc (control) was applied to NgR1-overexpressing Cos-7 cells and fo
* Mehrwertsteuer und Versandkosten nicht enthalten. Irrtümer und Preisänderungen vorbehalten