![]()
|
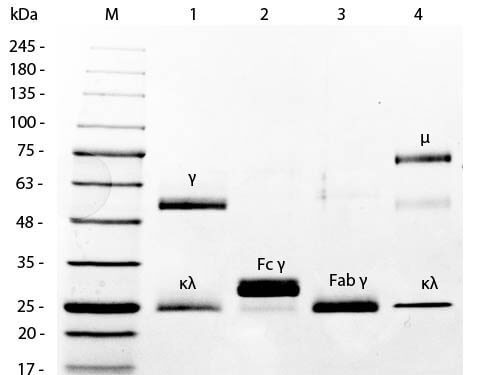
SDS-PAGE of Mouse IgG Whole Molecule Rhodamine Conjugated (p/n 010-0002). MW: 5 µL Opal Prestained Marker (p/n MB-210-0500). Lane 1: Reduced Mouse IgG Whole Molecule Rhodamine Conjugated (p/n 010-0002). Lane 2: Reduced Mouse F(c) Fragment (p/n 010-0103). Lane 3: Reduced Mouse F(ab) Fragment (p/n 010-0105). Lane 4: Mouse IgM Kappa Myeloma Protein (p/n 010-001-033). Load: 1 µg per lane. Predicted/Observed size: IgG at 50 and 25 kDa, F(c) at 25 kDa, F(ab) at 25 kDa, IgM K at 70 and 23 kDa. Observed F(c) Fragment migrates slightly higher. |
![]()
|
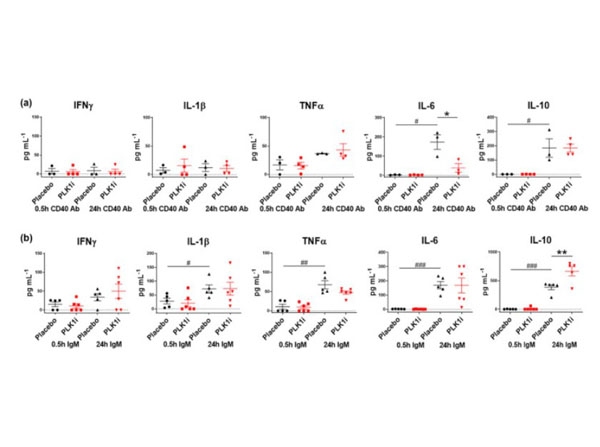
PLK1 regulates inflammatory cytokines induced by anti-CD40 and anti-IgM stimulationinvitro. Splenocytes were isolated from MLR.lprmice, stimulated with(a)anti-CD40 antibody or(b)anti-IgM for 0.5h and 24h, with or without PLK1 blockade. Secretion of inflammatory cytokine in the culture supernatant were measured by ELISA, including IFNgamma, IL-1beta, TNFalpha, IL-6 and IL-10. The assays were performed in triplicate. Female MRL.lpr, 10-week-old,n=3-6 per group. * indicates change between groups. indicates change within one group. *P<0.05, **P<0.01,P<0.05,P<0.01,P<0.001. Immunoglobulin (Ig) standards, including mouse IgM (p/n 010-0107), IgG or serum samples. Fig 6. PMID: 35024139. |
![]()
|
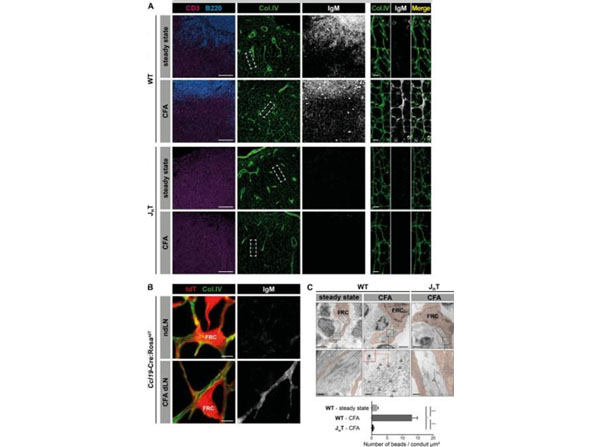
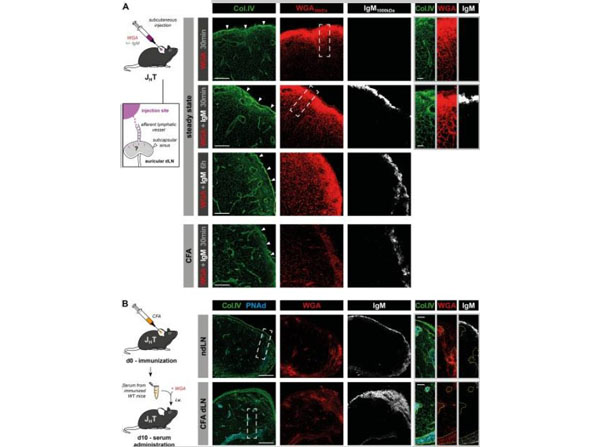
IgM localizes within the conduit system of reactive LNs. (A)Confocal imaging of reactive and steady state auricular LNs from WT (C57BL/6J) or B cell-deficient (JHT) mice, 10 d after intradermal CFA immunization in the ears. Sections were stained for CD3, B220, collagen IV (col.IV), and IgM. Insets display high-magnification views of collagen IV+conduits in the T cell zone. Bars, 100 µm (left panels), 10 µm (right panels). Data are representative of three experiments (two mice per condition and experiment).(B)Confocal imaging of auricular dLNs and contralateral ndLNs fromCcl19-Cre:RosatdTmice, 10 d after intradermal CFA injection in one ear. Sections were stained for collagen IV and IgM. tdT, tdTomato. Bars, 5 µm. Pictures are representative of three experiments (two mice per experiment).(C)Representative EM pictures of FRCs and conduits in steady state and auricular reactive LNs of WT and JHT mice, 10 d after intradermal CFA injection in one ear. Ultrathin sections were stained with 6-nm gold nanobeads specific for mouse IgM (highlighted with arrowheads), and the average number of beads located in the conduit lumen was evaluated for each condition. Bars, 2 µm (upper panels), 200 nm (lower panels). Data are representative of two experiments (one individual per condition and experiment). Results are expressed as mean SEM. *, P < 0.05, ****, P < 0.0001. Figure 1. PMID: 30429248. |
![]()
|
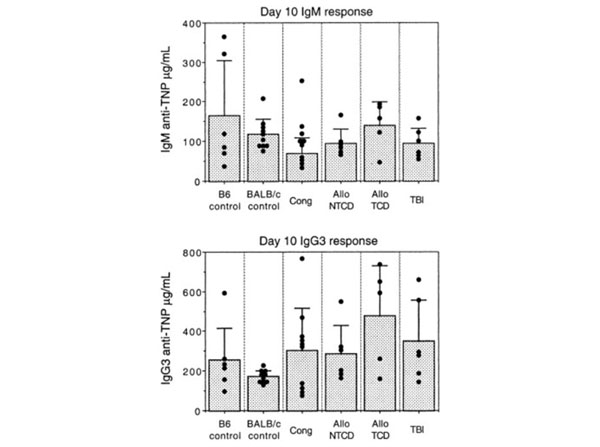
Comparison of TIAb responsesin IUT,TBI, and control mice.Mice were immunized intraperitoneally with 25 µg of TNP-Ficoll. Sera were obtained 10 days after immunization and tested for IgM andIgG3anti-TNP levels by sandwich ELISA. Each dot represents an individual mouse. Bar graphs represent average Ab levels SD. IUT mice were immunized starting at 12 weeks of age. TBI mice were challenged starting at 12 weeks after transplantation. Baseline total IgM and IgG serum levels were assessed as follows: 96-well ELISA plates were coated with goat anti-IgG (p/n 610-101-121) or goat anti-IgM Ab. Ig concentrations were calculated from standard curves generated with mouse IgM (p/n 010-0107) and IgG standards. Fig. 2.PMID: 12393436. |
![]()
|
Lymph- and blood-borne soluble IgM does not access the conduit system. (A)Unimmunized JHT mice or animals that received an intradermal injection of CFA 10 d before in one ear were injected s.c. with fluorescent WGA (38 kD) with or without purified mouse IgM (1,000 kD) and their auricular dLNs were harvested at the indica |
![]()
|
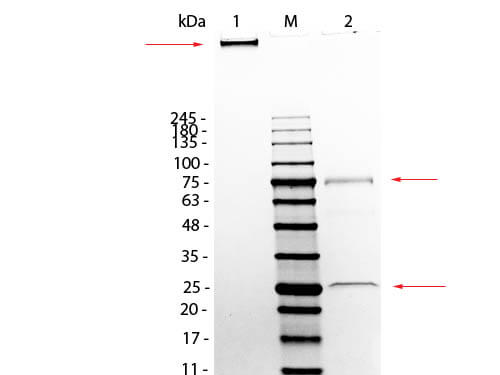
SDS-PAGE of Mouse IgM Whole Molecule. Lane 1: Mouse IgM, Non-Reduced. Lane 2: Mouse IgM, Reduced. Load: 1.0 µg per lane. Predicted/Observed size - Non-Reduced: 900 kDa (Pentamer), 900 kDa (Molecule larger than can pass through gel), Reduced: 78 and 25 kDa, 75 and 25 kDa. |