0.02 M Potassium Phosphate, 0.15 M Sodium Chloride, pH 7.2
Formulierung:
Liquid (sterile filtered)
Target-Kategorie:
Mouse
Antibody Type:
Primary Antibody
Application Verdünnung:
ELISA: 1:4,000 - 1:20,000, IHC: 1:1,000, IF Microscopy: User Optimized, IP: 10-30ul, WB: 1:500 - 1:3000
Anwendungsbeschreibung:
This antiserum has been tested for use in western blotting, immunoprecipitation and immunohistochemistry. Specific conditions for reactivity should be optimized by the end user. Expect bands approximately 150kDa by western blotting in the appropriate cel
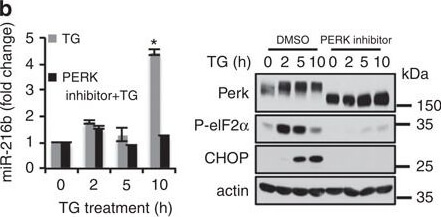
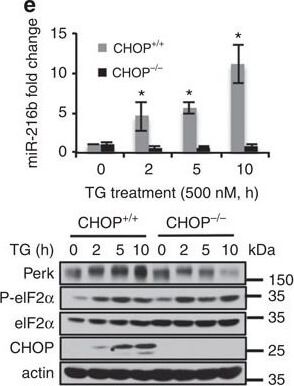
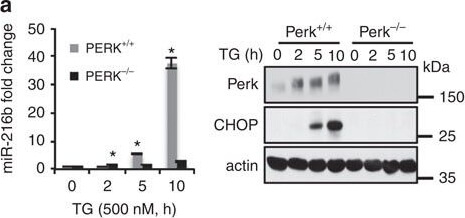
PERK-dependent miR-216b induction.(a) PERK+/+ and PERK-/- MEFs were treated with 500nM TG for indicated times. MiR-216b was assessed by qPCR (left graph), PERK and CHOP were assessed by immunoblot (right). (b) MiR-216b levels were quantified by qPCR following exposure of cells to thapsigargin and a small-molecule PERK inhibitor (left). PERK, eIF2alpha-p and CHOP induction were assessed by immunoblot (right). (c-e) MEFs of the indicated genotype were treated with TG (500nM) for indicated intervals. Protein extracts from these cells were immunoblotted for the proteins as indicated (lower panels) and miR-216b levels were quantified by qPCR (upper panels, n=3). (f) CHOP-/- MEFs were transfected with vector or CHOP and 2 days later treated with TG (500nM) for indicated intervals. Protein extracts from these cells were immunoblotted for CHOP and miR-216b levels quantified by qPCR (n=3). (g) MiR-216b expression and (h) c-Jun mRNA levels were analysed in MMTV-Neu tumours from either PERK+/+ or a PERK-/- background. Data represent means.d. of three independent observations. Statistical significance was analysed analysed by Students t-test. (*P<0.05, WT versus -/-). Figure provided by CiteAb. Source: Nat Commun, PMID: 27173017.
PERK-dependent miR-216b induction.(a) PERK+/+ and PERK-/- MEFs were treated with 500nM TG for indicated times. MiR-216b was assessed by qPCR (left graph), PERK and CHOP were assessed by immunoblot (right). (b) MiR-216b levels were quantified by qPCR following exposure of cells to thapsigargin and a small-molecule PERK inhibitor (left). PERK, eIF2alpha-p and CHOP induction were assessed by immunoblot (right). (c-e) MEFs of the indicated gen
Immunohistochemistry staining of mouse mammary gland samples from lactating mice (L10) with Rockland Immunochemicals anti-PERK. Positive staining signal observed in wild type mouse sample with anti-PERK staining only (middle image), but not in the knock out mouse sample (right image) and pre-immune serum staining (left image) The anti-PERK was diluted 1:1,000 in 5% goat serum in PBS and allowed to incubate for 2h at room temperature in a humidified chamber. Personal Communication. A, Diehl, Univ. of Pennsylvania, Philadelphia, PA.
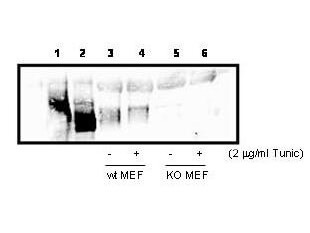
Western blot analysis using Rockland Immunochemicals anti-PERK to detect PERK in cell lysates. 300µg PERK over-expressing 293T cell lysate (lanes 1 & 2), or 800ug wild type (Lanes 3 & 4), and PERK knock out (lanes 5 & 6) MEF cell lysate were immunoprecipated with 15µl anti-PERK, followed by western blotting with 1:1000 dilution of anti-PERK in 5% milk/TBST buffer. Lane 1, 293T cells over-expressing Myc-PERK wt, Lane 2 , 293T cells over-expressing Myc-PERK K618A. Personal Communication. A, Diehl, Univ. of Pennsylvania, Philadelphia, PA.
PERK-dependent miR-216b induction.(a) PERK+/+ and PERK-/- MEFs were treated with 500nM TG for indicated times. MiR-216b was assessed by qPCR (left graph), PERK and CHOP were assessed by immunoblot (right). (b) MiR-216b levels were quantified by qPCR following exposure of cells to thapsigargin and a small-molecule PERK inhibitor (left). PERK, eIF2alpha-p and CHOP induction were assessed by immunoblot (right). (c-e) MEFs of the indicated genotype were treated with TG (500nM) for indicated intervals. Protein extracts from these cells were immunoblotted for the proteins as indicated (lower panels) and miR-216b levels were quantified by qPCR (upper panels, n=3). (f) CHOP-/- MEFs were transfected with vector or CHOP and 2 days later treated with TG (500nM) for indicated intervals. Protein extracts from these cells were immunoblotted for CHOP and miR-216b levels quantified by qPCR (n=3). (g) MiR-216b expression and (h) c-Jun mRNA levels were analysed in MMTV-Neu tumours from either PERK+/+ or a PERK-/- background. Data represent means.d. of three independent observations. Statistical significance was analysed analysed by Students t-test. (*P<0.05, WT versus -/-). Figure provided by CiteAb. Source: Nat Commun, PMID: 27173017.
* Mehrwertsteuer und Versandkosten nicht enthalten. Irrtümer und Preisänderungen vorbehalten