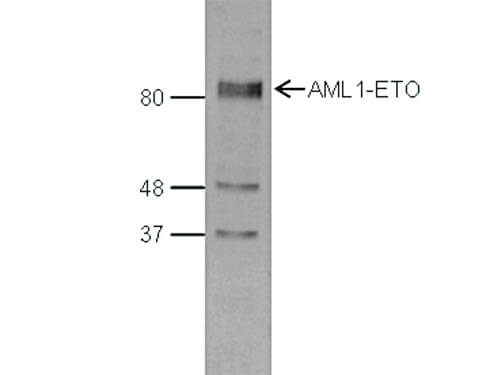
Anti-AML1-ETO Antibody has been tested in ChIP, ELISA and Western Blots. Specific conditions for reactivity should be optimized by the end user. Expect a band approximately 80 kDa in the appropriate cell lysate or extract.
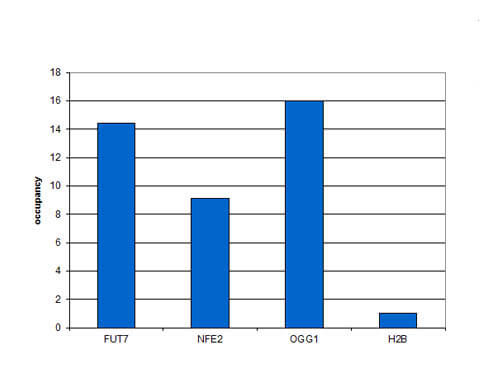
Chromatin Immunoprecipitation results of Rabbit Anti-AML1-ETO Antibody. Chromatin from 1.25 million formaldehyde cross-linked Kasumi-1 cells was used with 4ul of Anti-AML1-ETO Antibody and 20ul of magnetic IgG beads per immunoprecipitation. QPCR was performed using primers specific for the FUT7, NFE2 and OGG1 genes. ChIP results shows the occupancy, calculated as the ratio + control/background for which the H2B gene was used.
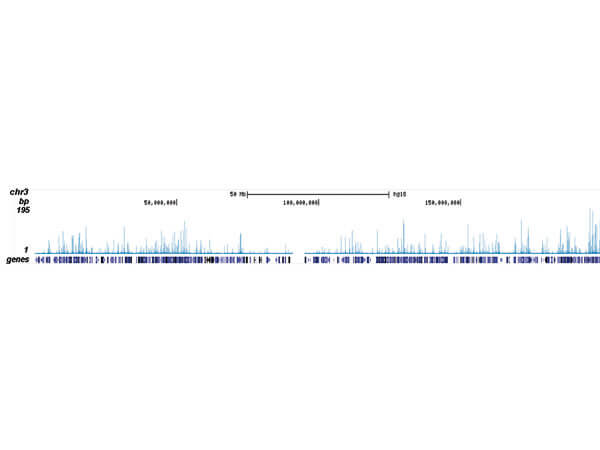
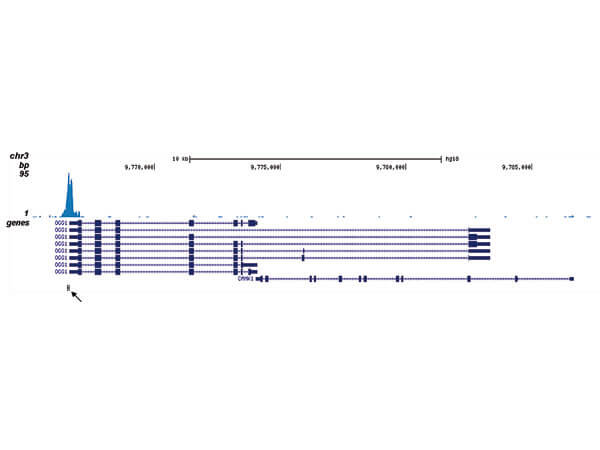
ChIP-seq results obtained with the antibody directed against AML1-ETO. ChIP was performed as described in figure 1. The IPd DNA from 6 ChIPs were pooled and analyzed with an Illumina Genome Analyzer. Library preparation, cluster generation, and sequencing were performed according to the manufacturers instructions. The 32 bp tags were aligned to the human reference genome (hg18) using the ELAND algorithm. Figure 2 shows the results of the complete chromosome 3. Figure 3-5 shows three genomic regions region surrounding the OGG1, FUT7 and NFE2 genes, respectively. The position of the PCR amplicon is indicated with an arrow.
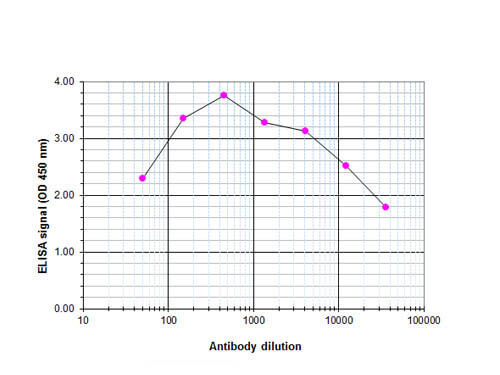
ELISA results of Rabbit anti-AML1-ETO antibody. Antigen: BSA conjugated AML1-ETO. Coating amount: 0.1 µg per well. Dilution series: serial dilution. Estimated Antibody Titer to be 1:32,750. Substrate: TMB (p/n TMBE-1000).
Western blot results of Rabbit Anti-AML1-ETO antibody. Lane 1: SKNO-1 Nuclear extract lysates. Load: 15 µg. Primary antibody: AML1-ETO antibody at 1:1000 overnight at 4C. Secondary antibody: Goat Anti-rabbit HRP secondary antibody at 1:10,000 for 45 min at RT. Block: 5% BLOTTO/TBST overnight at 4C.
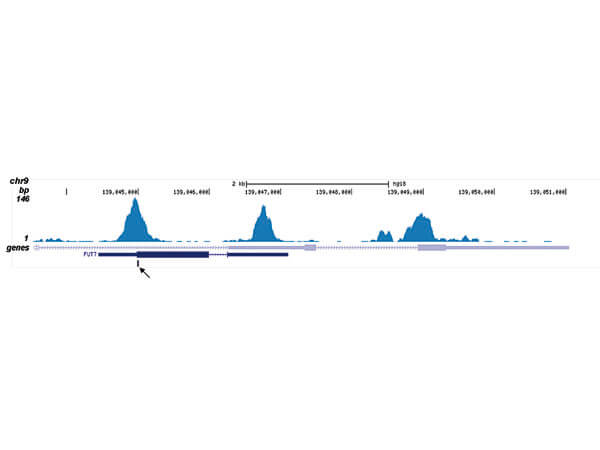
ChIP-seq results obtained with the antibody directed against AML1-ETO. ChIP was performed as described in figure 1. The IPd DNA from 6 ChIPs were pooled and analyzed with an Illumina Genome Analyzer. Library preparation, cluster generation, and sequencing were performed according to the manufacturers instructions. The 32 bp tags were aligned to the human reference genome (hg18) using the ELAND algorithm. Figure 2 shows the results of the complete chromosome 3. Figure 3-5 shows three genomic regions region surrounding the OGG1, FUT7 and NFE2 genes, respectively. The position of the PCR amplicon is indicated with an arrow.
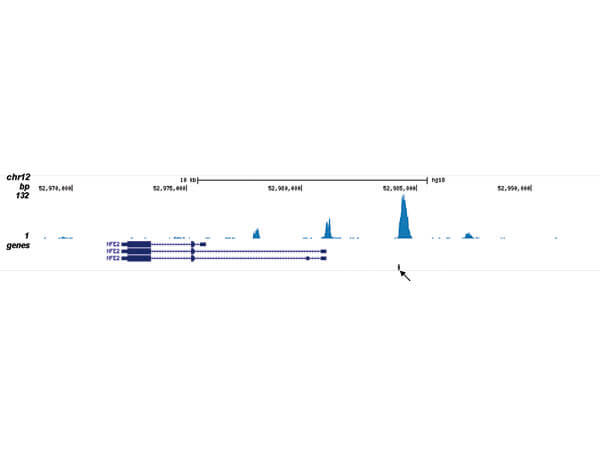
ChIP-seq results obtained with the antibody directed against AML1-ETO. ChIP was performed as described in figure 1. The IPd DNA from 6 ChIPs were pooled and analyzed with an Illumina Genome Analyzer. Library preparation, cluster generation, and sequencing were performed according to the manufacturers instructions. The 32 bp tags were aligned to the human reference genome (hg18) using the ELAND algorithm. Figure 2 shows the results of the complete chromosome 3. Figure 3-5 shows three genomic regions region surrounding the OGG1, FUT7 and NFE2 genes, respectively. The position of the PCR amplicon is indicated with an arrow.
ChIP-seq results obtained with the antibody directed against AML1-ETO. ChIP was performed as described in figure 1. The IPd DNA from 6 ChIPs were pooled and analyzed with an Illumina Genome Analyzer. Library preparation, cluster generation, and sequencing were performed according to the manufacturers instructions. The 32 bp tags were aligned to the human reference genome (hg18) using the ELAND algorithm. Figure 2 shows the results of the complete chromosome 3. Figure 3-5 shows three genomic regions region surrounding the OGG1, FUT7 and NFE2 genes, respectively. The position of the PCR amplicon is indicated with an arrow.
* Mehrwertsteuer und Versandkosten nicht enthalten. Irrtümer und Preisänderungen vorbehalten