POL II phospho S2 Antibody, IgG1, Mouse, Monoclonal
Artikelnummer:
ROC-200-301-V00
Hersteller Artikelnummer:
200-301-V00
Alternativnummer:
ROC-200-301-V00
Hersteller:
Rockland Immunochemicals
Wirt:
Mouse
Kategorie:
Antikörper
Applikation:
ChIP, ELISA, IF, WB
Spezies Reaktivität:
Human
Immunogen:
Anti-Pol II S2p Antibody was produced in mice by repeated immunization with the YSPTSPS repeat in the B1 subunit of RNA polymerase II phosphorylated at Ser2 of the repeated sequence.
Konjugation:
Unconjugated
Alternative Synonym:
DNA-directed RNA polymerase II subunit RPB1, RNA polymerase II subunit B1, DNA directed RNA polymerase II subunit A, DNA-directed RNA polymerase III largest subunit, RNA-directed RNA polymerase II subunit RPB1
0.01 M Sodium Phosphate, 0.25 M Sodium Chloride, pH 7.2
Formulierung:
Liquid (sterile filtered)
Target-Kategorie:
Human
Antibody Type:
Primary Antibody
Application Verdünnung:
ELISA: 1:3,000, ChIP: 1 µg/ChIP, IF Microscopy: 1:500, WB: 1:1,000
Anwendungsbeschreibung:
Anti-Pol II pS2 Antibody is tested for Chromatin Immunoprecipitation Sequencing, Chromatin Immunoprecipitation, ELISA, Immunofluorescence and Western Blots. Specific conditions for reactivity should be optimized by the end user. Expect a band approximate
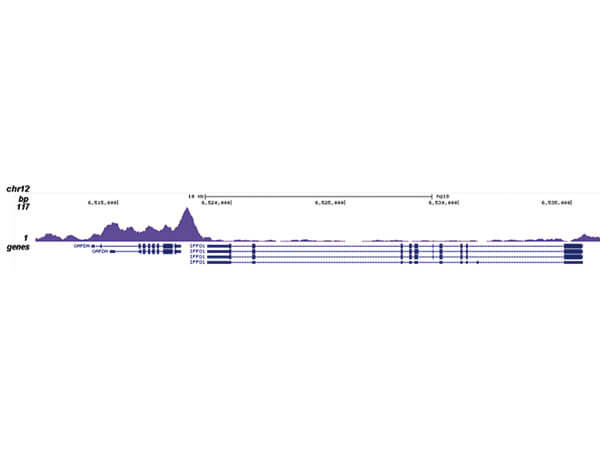
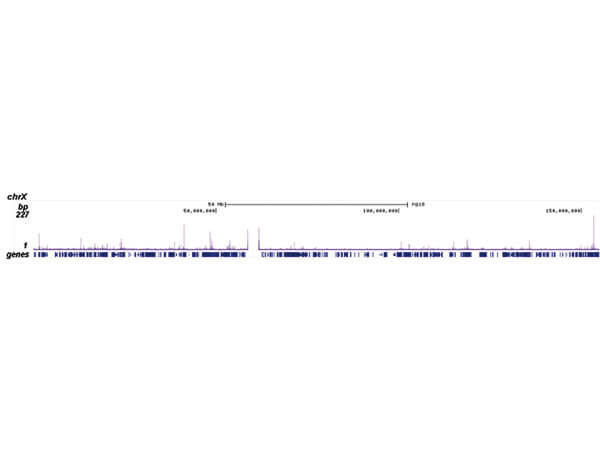
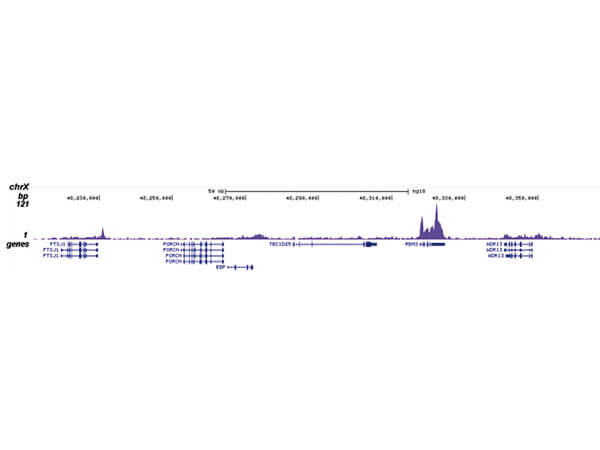
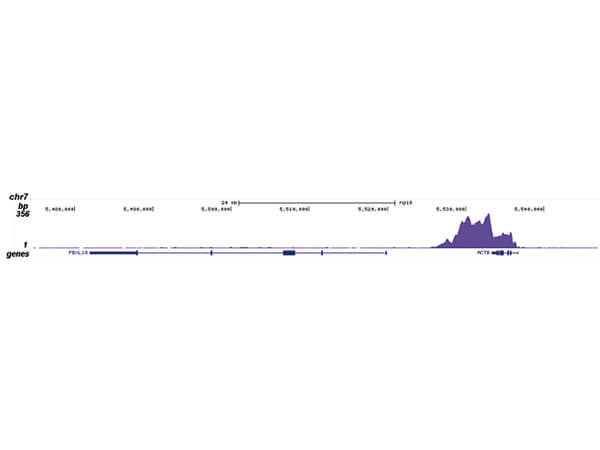
ChIP was performed on sheared chromatin from 1 million HeLaS3 cells using 1 µg of the antibody against Pol II S2p. The IPd DNA was subsequently analyzed on an Illumina Genome Analyzer. The 36 bp tags were aligned to the human genome using the ELAND algorithm. Fig 4 shows the peak distribution along the complete sequence, a 150 kb region of the X-chromosome (Fig 5), and in a two genomic regions surrounding the GAPDH (Fig 6) and ACTB positive control genes (Fig 7).
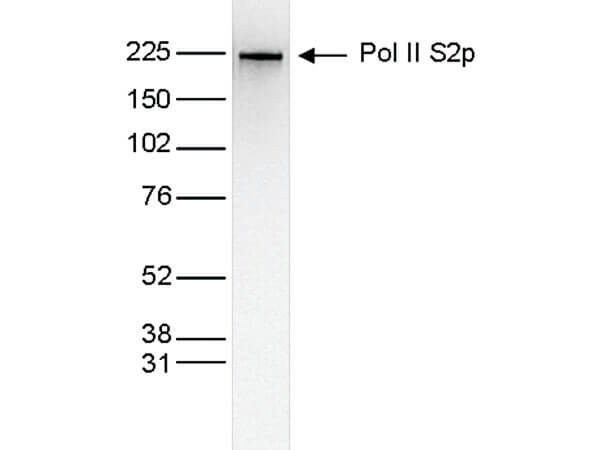
Western Blot results of Mouse anti-Pol II S2p antibody. Lane 1: HeLa Nuclear Extracts 25µg. Primary antibody: Mouse anti-Pol II S2p antibody at 1:1000 overnight at 4C. Secondary antibody: Peroxidase anti-mouse secondary antibody at 1:10,000 for 45 min at RT. Block: TBS-Tween containing 5% BLOTTO. Predicted/Observed size: ~217 kDa for Mouse Pol II S2p.
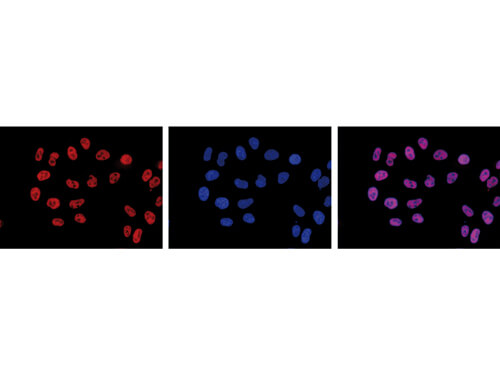
Immunofluorescence Microscopy results of Mouse anti-Pol II S2p antibody. Tissue: HeLa cells. Fixation: methanol. Block: PBS/TX-100 containing 5% normal goat serum and 1% BSA. Primary antibody: Pol II S2p antibody at 1:500 for 1 hr at RT (left). Secondary antibody: anti-Mouse Alexa594 secondary antibody at 1:10,000 for 45 min at RT. Staining: Pol II S2p antibody as red fluorescent signal (left), DAPI blue (middle), merge of the two staining (right).
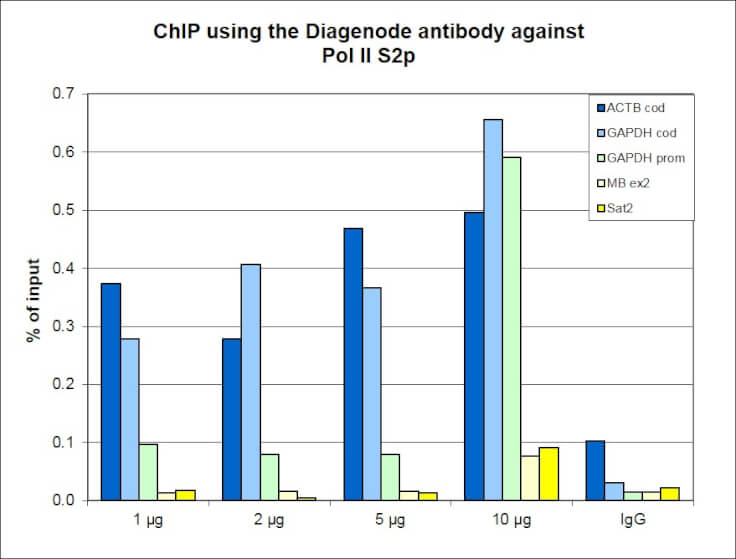
Chromatin Immunoprecipitation for Mouse Anti-Pol II S2p Antibody. ChIP was performed using sheared chromatin from 1 million HeLa cells. A titration consisting of 1, 2, 5 and 10 µg of antibody per experiment was analyzed. IgG, exon 2 of the inactive myoglobin gene, and Sat2 satellite was used as a negative IP control, GAPDH and ACTB genes, used as positive controls. Figure shows the recovery, expressed as a % of input (the relative amount of IP DNA compared to input DNA after qPCR analysis).
ChIP was performed on sheared chromatin from 1 million HeLaS3 cells using 1 µg of the antibody against Pol II S2p. The IPd DNA was subsequently analyzed on an Illumina Genome Analyzer. The 36 bp tags were aligned to the human genome using the ELAND algorithm. Fig 4 shows the peak distribution along the complete sequence, a 150 kb region of the X-chromosome (Fig 5), and in a two genomic regions surrounding the GAPDH (Fig 6) and ACTB positive control genes (Fig 7).
ChIP was performed on sheared chromatin from 1 million HeLaS3 cells using 1 µg of the antibody against Pol II S2p. The IPd DNA was subsequently analyzed on an Illumina Genome Analyzer. The 36 bp tags were aligned to the human genome using the ELAND algorithm. Fig 4 shows the peak distribution along the complete sequence, a 150 kb region of the X-chromosome (Fig 5), and in a two genomic regions surrounding the GAPDH (Fig 6) and ACTB positive control genes (Fig 7).
ChIP was performed on sheared chromatin from 1 million HeLaS3 cells using 1 µg of the antibody against Pol II S2p. The IPd DNA was subsequently analyzed on an Illumina Genome Analyzer. The 36 bp tags were aligned to the human genome using the ELAND algorithm. Fig 4 shows the peak distribution along the complete sequence, a 150 kb region of the X-chromosome (Fig 5), and in a two genomic regions surrounding the GAPDH (Fig 6) and ACTB positive control genes (Fig 7).
* Mehrwertsteuer und Versandkosten nicht enthalten. Irrtümer und Preisänderungen vorbehalten