Anti-Fluorescein Antibody has been tested by ELISA and western blot and is suitable for immunomicroscopy, in situ hybridization and flow cytometry or FACS analysis as well as other antibody based fluorescent assays requiring lot-to-lot consistency.
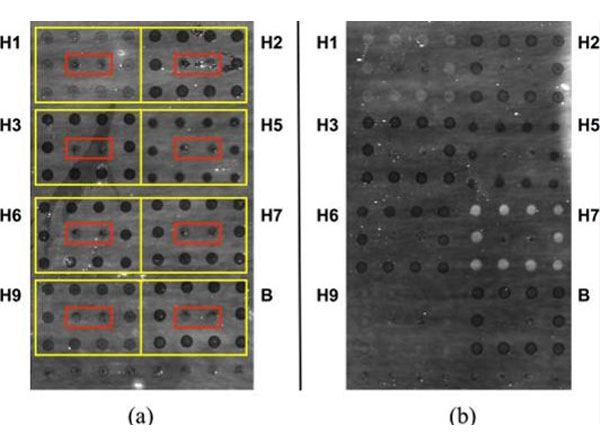
Strong responses to polyclonal anti-HA antiserum are readily observable on an AIR hemagglutinin microarray.(a) 1% BSA control (p/n BSA-10). (b) Anti-H7 polyclonal antiserum (A/Netherlands/219/2003, H7N7), 1:80 dilution (1.3%) in 1% BSA. Spots showing substantially increased brightness indicate binding to immobilized H7. In both cases, antigens were arrayed in square patterns as indicated by the yellow boxes in (a), a mouse IgG Fc domain (p/n 010-0103) was included as negative control (red boxes). Slight differences in spot intensity in the control (a) are due to differences in deposition efficiency for different antigens or controls. Specific antigens used in these experiments are indicated inTable 2. Goat anti-fluorescein, (p/n 600-101-096) used as an internal negative control.Fig 1. PMID: 26241048.
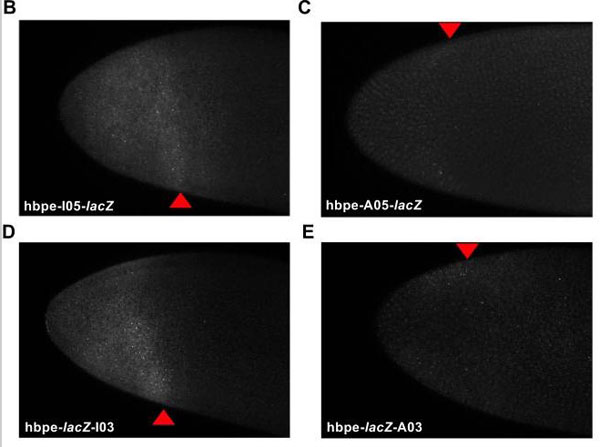
Self-cleaving ribozymes can tune gene expression inDrosophilaembryos. (B-E)Representative images ofin situhybridizedDrosophilaembryos probed forlacZ. Each embryo imaged expresseslacZunder the control of the hbpe and contains an inactive(B/D)or active(C/E)ribozyme. Red triangles represent the width of thelacZgradient.Fig 3. PMID: 32352996.
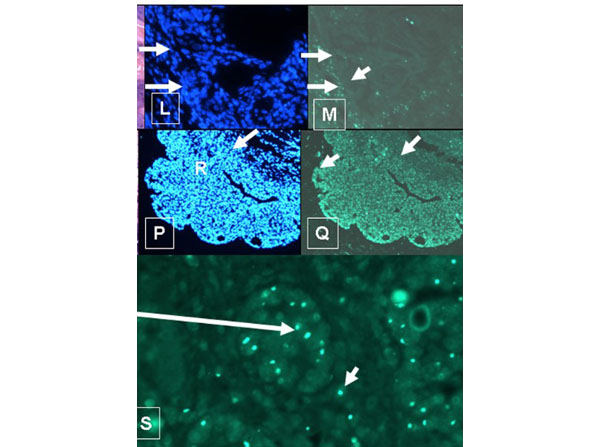
L-M. Squamous cell carcinoma from mouse 1, P-S. Breast cancer from mouse 4. L-MSquamous cell carcinoma from mouse 1. The squamous cell carcinoma in the breast of mouse 1 does not contain Y-Chromosomes, whereas the breast adenocarcinoma in mouse 4 (E-F) does. L. DAPI (nuclei), M. in situ for Y-chromosome (40X). The arrows mark the border between the squamous cell carcinoma and the stroma. P-S. Breast Cancer from mouse 4. P. DAPI showing nuclei in the tumor. Q. In situ for Y-chromosomes (20X) showing up to 80% of nuclei in tumor contain Y-chromosome in this section. The arrows in O-Q delineate the border of the stroma and the tumor. In contrast to M, Q shows that the tumor labels strongly for Y-chromosomes, whereas the stroma is weakly labeled. S in situ for Y-chromosome of breast adenocarcinoma (40X). The larger arrow shows a focus of cancer in the H&E section that is labeled for Y-chromosome in a serial section. Figure 1. PMID: 19816927.
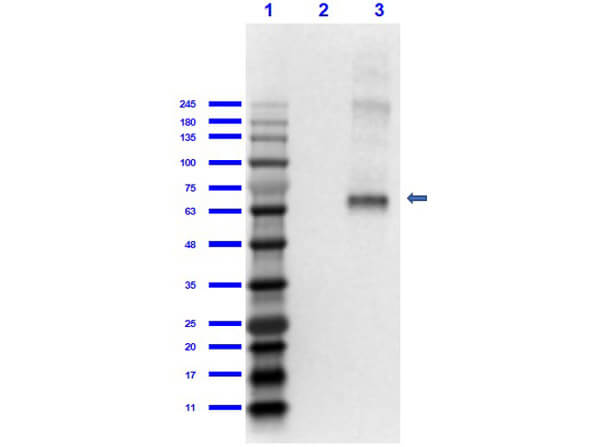
Western Blot of Goat Anti-Fluorescein Antibody. Lane 1: Opal Prestained Molecular Weight Marker (p/n MB-210-0500). Lane 2: Bovine Albumin (BSA) (p/n 001-0133) [0.05µg]. Lane 3: Bovine Albumin-Fluorescein (BSA-FITC) (p/n 001-0233) [0.05µg]. Primary Antibody: Gt-anti-Fluorescein 1.0µg/mL overnight at 2-8C. Secondary Antibody: Donkey Anti-Goat HRP (p/n 605-703-002) at 1:40,000 for 30mins at RT. Block: 5% BLOTTO (p/n B501-0500) in 1X PBS for 1hr at RT. Predicted MW: ~60kDa. Observed MW: ~65kDa. Exposure: 1sec.
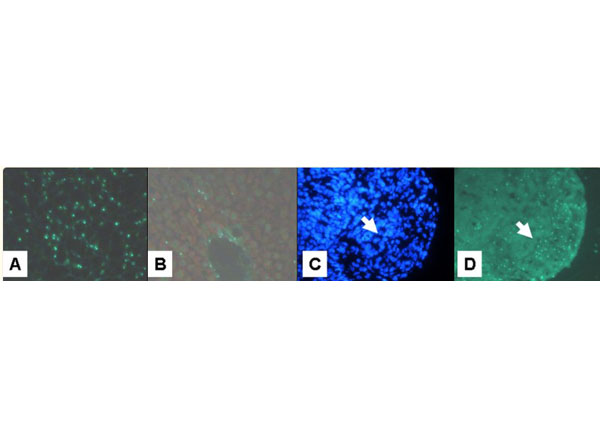
A-D. Y-chromsome labeling of control and experimental lesions.A.Male liver. Note high labeling of hepatocytes (70%). This is the expected frequency as some Y-chromosomes are not in the plane of the tissue section.B.Liver from female recipient of male bone marrow. Hepatocytes are not labeled, but many endothelial cells and Kupffer cells are.C,DLung adenocarcinoma. C. DAPI, D. FISH. The tumor cells do label for Ychromosomes, whereas the stromal cells are heavily labeled. The arrows show the demarcation between the tumor and the stroma. Fig 2. PMID: 19816927.
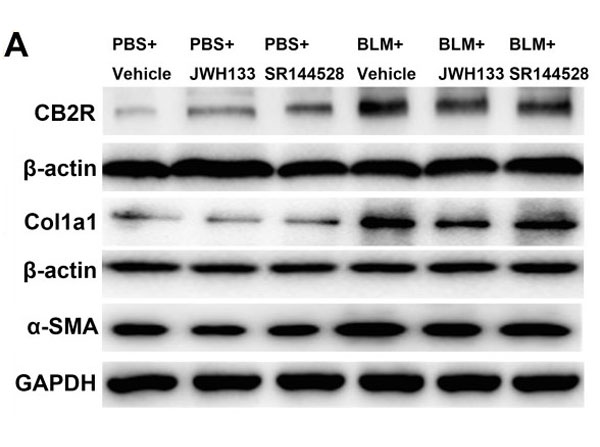
CB2R agonist JWH133 prevents bleomycin-induced collagen I expression in mice lung tissue. (A) The expression of cannabinoid receptor type 2 (CB2R), collagen I (Col1a1) and alpha-SMA (Acta2) were evaluated by western blotting. Figure 5. PMID: 29262578.
* Mehrwertsteuer und Versandkosten nicht enthalten. Irrtümer und Preisänderungen vorbehalten