
ATG13 phospho S318 Antibody, Rabbit, Polyclonal
Artikelnummer:
ROC-600-401-C49S
- Bilder (6)
| Artikelname: | ATG13 phospho S318 Antibody, Rabbit, Polyclonal |
| Artikelnummer: | ROC-600-401-C49S |
| Hersteller Artikelnummer: | 600-401-C49S |
| Alternativnummer: | ROC-600-401-C49S |
| Hersteller: | Rockland Immunochemicals |
| Wirt: | Rabbit |
| Kategorie: | Antikörper |
| Applikation: | DOT, ELISA, WB |
| Spezies Reaktivität: | Human |
| Immunogen: | This affinity purified antibody was prepared by repeated immunizations with a synthetic peptide corresponding to the region near S318 of ATG13. |
| Konjugation: | Unconjugated |
| Alternative Synonym: | rabbit anti-ATG13 pS318 Antibody, ATG-13, ATG 13, Autophagy-related protein 13, KIAA0652 |
| Application Verdünnung: | ELISA: 1:25,000-1:175,000, Flow Cytometry: User Optimized, WB: 1:1000 |
| Anwendungsbeschreibung: | This affinity purified antibody has been tested for use in ELISA and by western blot. Specific conditions for reactivity should be optimized by the end user. Expect a band approximately 56.6 kDa in size corresponding to human phosphorylated ATG13 protein |
|
|
|
|
|
|
|
|
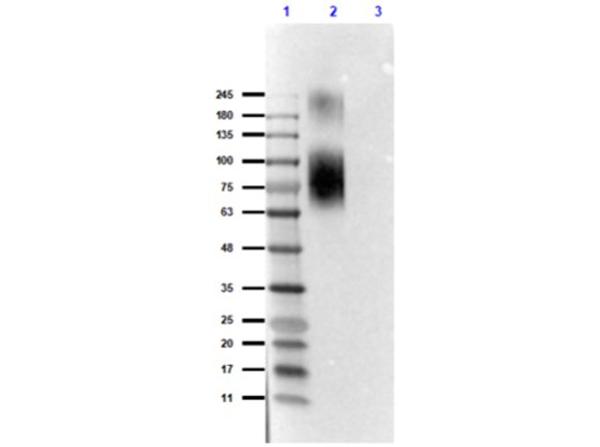
Western Blot of Rabbit Anti-ATG13pS318 Antibody. Lane 1: Opal Prestained Molecular Weight Marker (p/n MB-210-0500). Lane 2: BSA Conjugated ATG13 phospho S318 peptide - reduced [0.2µg]. Lane 3: BSA Conjugated ATG13 non-phospho S318 peptide - reduced [0.2µg]. Primary Antibody: Anti-ATG13pS318 [Rabbit] Antibody at 1.0µg/mL overnight at 2-8C. Secondary Antibody: Anti-Rabbit IgG [Goat] Peroxidase conjugated (p/n 611-1302) at 1:40,000 for 30mins at RT. Block: Blocking Buffer for Fluorescent Western Blotting (p/n MB-070) for 1hr at RT. Expected: detects the phospho S318 peptide and does not detect the NP-peptide.Exposure: 6.1sec. |
|
|
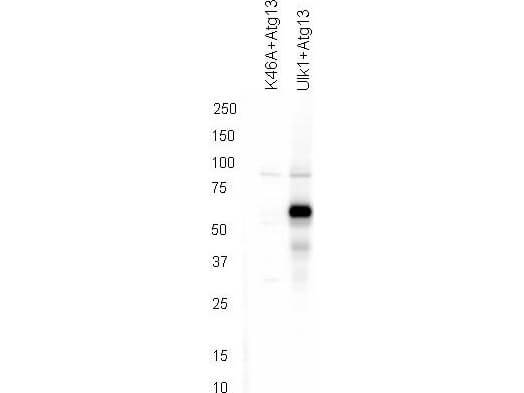
Western blot using Rocklands affinity purified anti-ATG13 pS318 antibody shows detection of phosphorylated ATG13 in 293T cells engineered to coexpress Ulk1 and Atg13 (Ulk1 + Atg13). In the left lane was loaded kinase-dead hypophosphorylated Ulk1-K46A mutant + ATG13. The right lane contains the 293T Ulk1 + ATG13 lysate and shows detection at approximately 57 kDa. The antibody was purified and resolved by SDS-PAGE, then transferred to nitrocellulose membrane. The membrane was blocked with 5% Blotto (p/n B501-0500) and probed with the primary antibody at 1µg/mL overnight at 4C. After washing, the membrane was probed with Goat Anti-Rabbit HRP secondary 1:5000 in detection buffer (p/n MB-070) for 45 minutes at room temperature. In collaboration with Charles Dorsey at Eli Lilly, Indianapolis, IN and John Cleveland at Scripps, Jupiter, FL. |
|
|
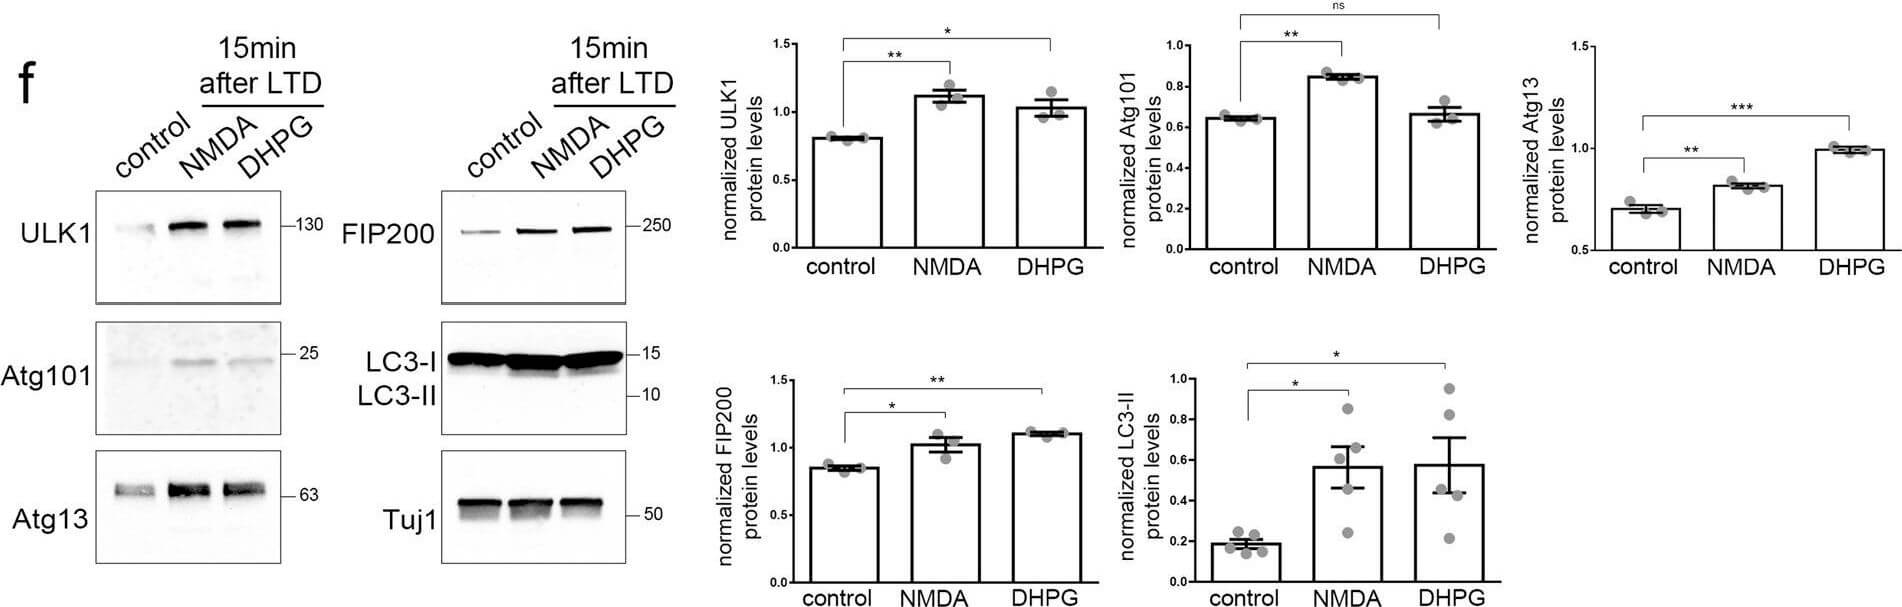
Autophagic vesicles are locally formed in dendrites of cultured neurons following LTD. A) Top, representative super-resolution microscopy dSTORM image of a secondary dendrite labeled with an antibody against LC3, 15min after cLTD. Bottom, magnification of representative U-shaped LC3-positive structures in dendrites, 15min after NMDA or DHPG pulses. Scale bars: 2µm and 250nm, as indicated. (N=3 independent experiments). B) Graph showing the number of LC3-positive U-shaped structures in secondary dendrites visualized in (a), before (control) and 15min or 60min after NMDAR- and mGluR-LTD. Bars represent mean valuesSEM. N=3 independent experiments per condition (n>9 dendrites per condition). Statistical analysis was performed by one-way ANOVA. For the time point of 15minF(2, 33)=17.93, p<0.0001) (Tukeys test Pcontrol-NMDA<0.0001, Pcontrol-DHPG<0.0001). For the time point of 60minF(2, 21)=9.459, p=0.0012) (Tukeys test Pcontrol-NMDA=0.0041, Pcontrol-DHPG=0.0024). C) Graph showing the size distribution (nm) of the dendritic U-shaped LC3-positive structures visualized in a upon NMDAR- and mGluR-LTD. Bars represent mean valuesSEM for each analysed dendrite. N=3 independent experiments (n>40 dendrites per condition). D) Confocal images of dendrites immunolabeled with antibodies against WIPI2, LC3, and MAP2 before (control) or after 15min of NMDAR- and mGluR-LTD. Scale bar: 10µm. (N=6 independent experiments). E) Representative confocal images of neurons immunolabeled with antibodies against ULK1, Atg101, Atg13, FIP200 and, along with MAP2 to label dendrites before (control) or 15min after LTD-inducing pulses. Scale bar: 20µm. Graphs showing the number of puncta positive for each ULK1-complex component in secondary dendrites, normalized for dendrite length, in every condition, as indicated. Graph bars represent mean valuesSEM. N=6 independent experiments per condition. Statistical analyses were performed using one-way ANOVA. ULK1: F(2,15)=24.48, P<0.0001 (Tukeys multiple comparison test, Pcontrol_NMDAR<0.0001, Pcontrol_mGluR<0.0001, PNMDAR_mGluR=0.8825). Atg101: F(2,15)=24.31, P<0.0001 (Tukeys multiple comparison test, Pcontrol_NMDAR<0.0001, Pcontrol_mGluR<0.0001, PNMDAR_mGluR=0.9329). Atg13: F(2,15)=8.386, P=0.0036 (Tukeys multiple comparison test, Pcontrol_NMDAR=0.007, Pcontrol_mGluR=0.0086, PNMDAR_mGluR=0.9940). FIP200: F(2,15)=17.66, P=0.0001 (Tukeys multiple comparison test, Pcon |
|
|
Produktgarantie und fachkundiger Support
