Anti-Rabbit IgG (H&L) Biotin Antibody has been tested by ELISA and is ideal for ELISA, western blotting, Immunohistochemistry, Fluorescence Microscopy, Flow Cytometry as well as other antibody detection methods.
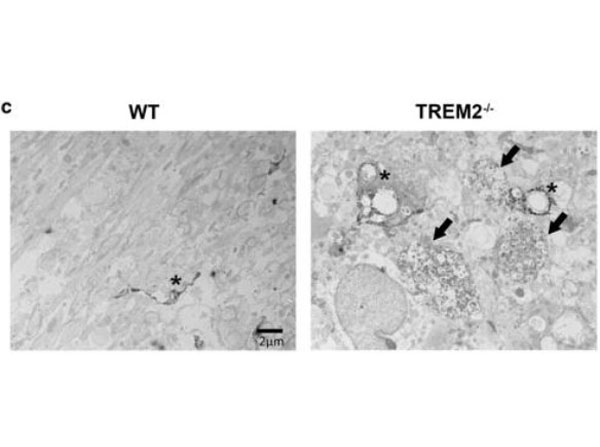
Immuno-electron microscopy using biotinylated anti-rabbit and streptavidin-HRP.TREM2-/-mice show more severe axonal pathology after CPZ.(c)EM images of WT and TREM2-/-at 12 weeks of CPZ treatment.Black arrowsindicate dystrophic autophagocytic axons andasterisksindicate Iba1+immunolabeled microglia. Fig. 2.PMID: 25631124.
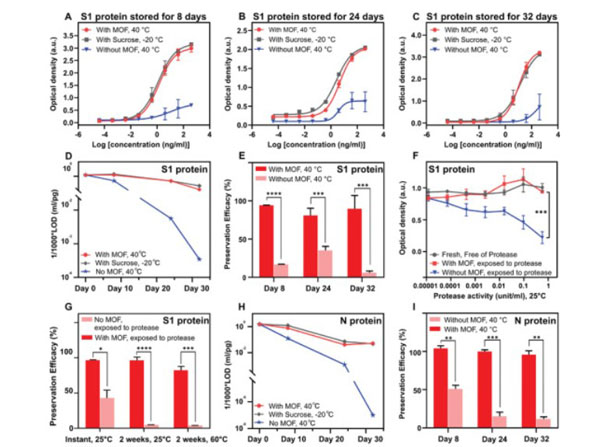
ELISA standard curves obtained from microtiter plates coated with SARS-CoV-2 S1 protein and stored under different conditions for A) 8 days, B) 24 days, and C) 32 days. D) Preservation efficacy as calculated from the OD values in the linear range of ELISA standard curves of SARS-CoV-2 S1 protein-coated microtiter plates. E) Comparison of LODs of SARS-CoV-2 S1 protein coated plates stored under different conditions. F) OD values obtained from SARS-CoV-2 S1 protein-coated plates after treatment with different concentrations of proteases. G) Preservation efficacy of ZIF-90 protected plates after thermal treatment and then exposing to protease. H) Comparison of LODs of SARS-CoV-2 N protein coated microtiter plates stored under different conditions. I) Preservation efficacy as calculated from the OD values in the linear range of ELISA standard curves of SARS-CoV-2 N protein precoated plates. E-G, I) n=2, *P < 0.05, **P < 0.01, ***P < 0.005, ****P < 0.0001, analyzed by unpaired t-test. Data represent mean s.d. Fig 3. PMID: 34297470.
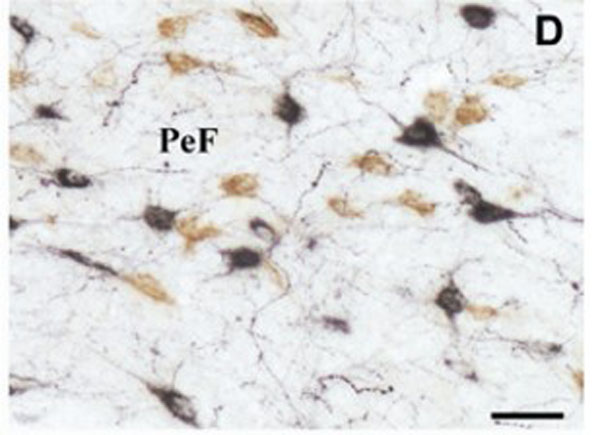
Immunohistochemistry using Donkey anti-rabbit IgG biotin conjugated. (B) Similar results were observed by using double immunohistochemical staining with MCH (in black) and nesf-1 (in brown). Scale bars 50 m (D), 25 m (B). Fig. 3. PMID: 18573315.
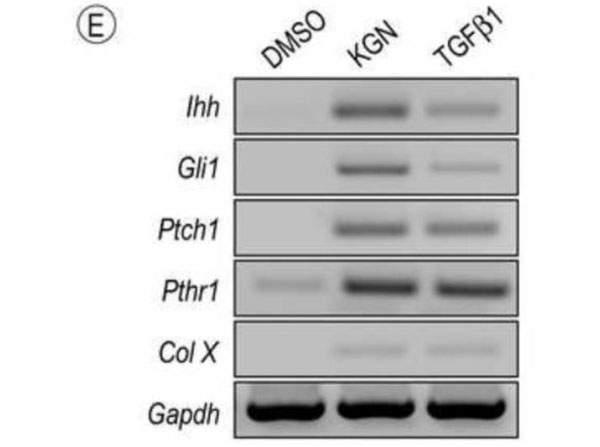
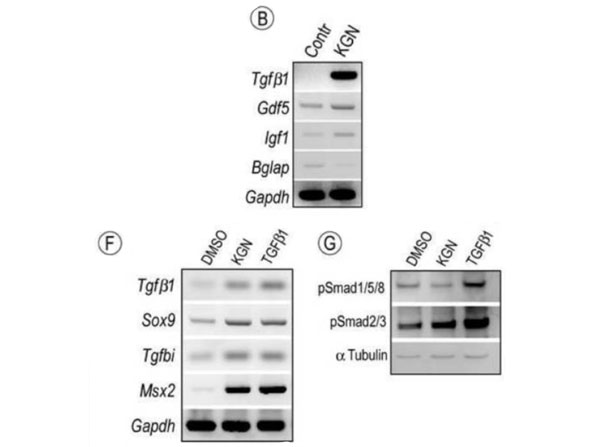
Hedgehog signaling is stimulated by KGN. (E) RT-PCR analysis of hedgehog signaling and maturation related molecules in E12.5 limb bud mesenchymal cells maintained in micromass culture and treated with 100nM KGN or 2.5 ng/ml TGFbeta1 for 24h. Note that similar responses were achieved by treatment with either KGN or TGFbeta1. Fig. 5. PMID: 25238962.
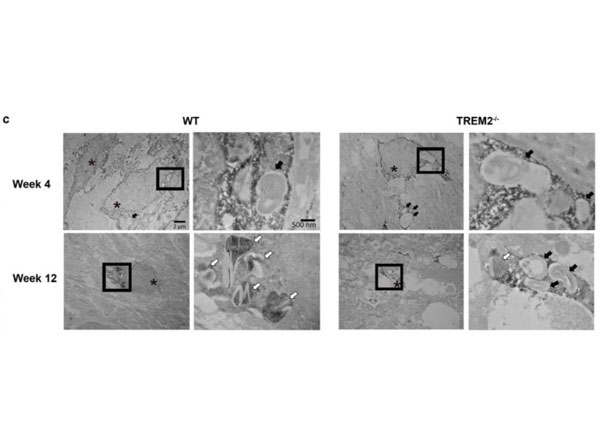
Immuno-electron microscopy using biotinylated anti-rabbit and streptavidin-HRP.Defect in myelin degradation in TREM2-/-microglia.(c)Immuno-EM images of TREM2-/-and WT microglia stained with Iba1 in the CC at 4 and 12 weeks on CPZ treatment. Images on the left in WT and TREM2-/-panels at week 4 and 12 (3,000* magnification) depict Iba+microglial cells (asterisks). A higher magnification (15,000*) for theboxed areais shown on therightof each image.Black arrowsindicate phagosomes containing myelin debris.White arrowsindicate pi granules. Fig. 7.PMID: 25631124.
Immunohistochemistry using Donkey anti-rabbit IgG biotin conjugated. (D) Similar results were observed by using double immunohistochemical staining with Hcrt (in black) and nesf-1 (in brown). Scale bars 50 m (D), 25 m (B). Fig. 3. PMID: 18573315.
Modulation of signaling protein activities and growth factor expression by KGN. (A-B) E12.5 limbs were maintainedex vivoin control conditions or medium containing 1 µM KGN or 10uL/mL DMSO as control. (A) Graphic representation of genes regulated more than two fold by KGN treatment in putative joint sites after 96h. Note the multi-fold induction ofTGFbeta1, Gdf5andIGF1expression with
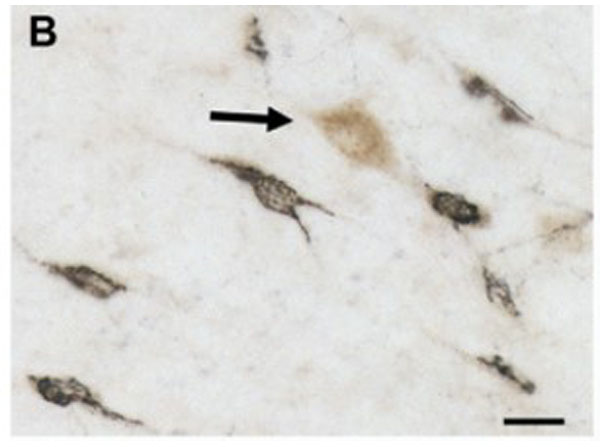
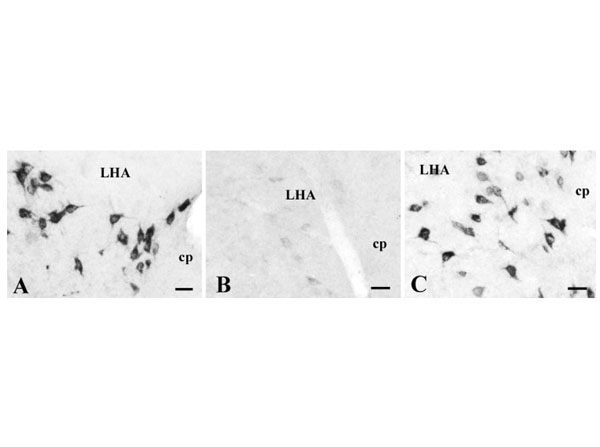
Immunohistochemistry using Donkey anti-rabbit IgG biotin conjugated. Specificity of the Ab24 antiserum. Photomicrographs of hypothalamic sections from the same rat processed simultaneously for nesf-1 immunodetection (with DAB-ni procedure) with normal Ab24 antiserum (control, A), pre-adsorbed antiserum with nesf-1 antigen (B) or pre-reacted primary antiserum with an excess of MCH (C). Notice the labeling extinction when using the pre-adsorbed Ab24 (B) vs. control (A), supporting its high specificity for nesf-1. Further, the primary antiserum pre-reacted with MCH did not induce qualitative or quantitative staining differences (C) vs. control (A), eliminating the possibility of Ab24 cross-reaction with MCH, co-expressed in nesf-1-immunoreactive neurons. Scale bars50 m. Fig. 4. PMID: 18573315.
* Mehrwertsteuer und Versandkosten nicht enthalten. Irrtümer und Preisänderungen vorbehalten