0.02 M Potassium Phosphate, 0.15 M Sodium Chloride, pH 7.2
Formulierung:
Lyophilized
Target-Kategorie:
Sheep
Antibody Type:
Secondary Antibody
Application Verdünnung:
FLISA: >1:20,000, IF Microscopy: >1:5,000, WB: >1:10,000
Anwendungsbeschreibung:
This product is designed for immunofluorescence microscopy, fluorescence based plate assays (FLISA) and fluorescent western blotting. This product is also suitable for multiplex analysis, including multicolor imaging, utilizing various commercial platfor
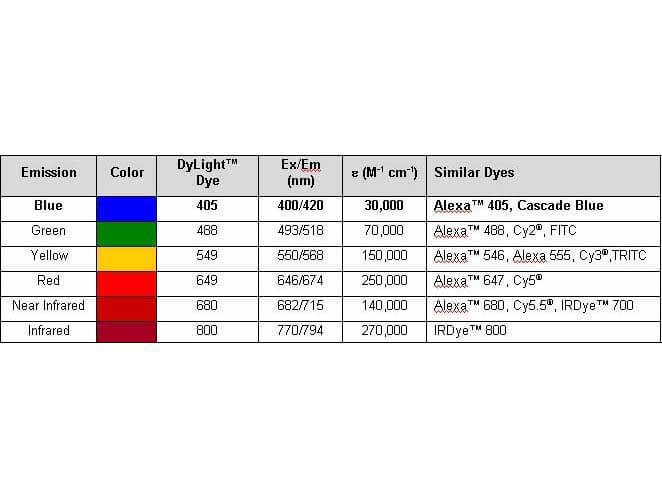
Properties of DyLight(TM) Conjugates.
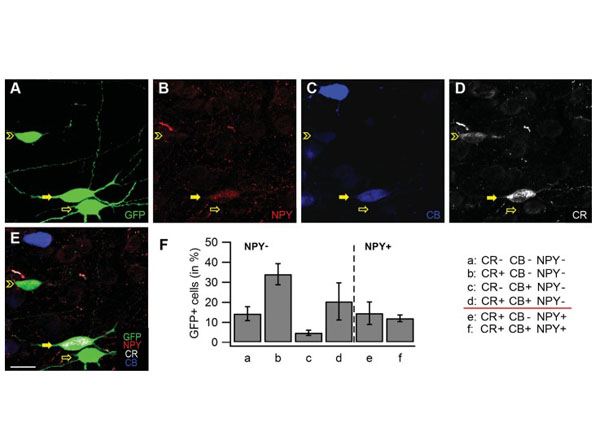
Analysis of coexpression of calretinin (CR), calbindin (CB), and NPY in GFP 1 cells in the cingulate cortex of FVBTg(GadGFP)45704Swn/J mice. A-E: Representative confocal images of cells in layers II-III of the cingulate cortex immunopositive for GFP (green), NPY (red), CR (white), and CB (blue). The solid yellow arrow indicates GFP1/CR1/CB1/NPY 1 cells, the open yellow arrow GFP1/CR2/CB2/NPY2 cells, and the open yellow arrowhead GFP1/CR1/CB1/NPY2 cells. F: Mean 6 standard deviation of relative numbers of GFP1/CR2/CB2/NPY2 cells (a), GFP1/CR1/CB2/NPY2 cells (b), GFP1/CR2/CB1/NPY2 cells (c), GFP1/CR1/ CB1/NPY2 cells (d), GFP1/CR1/CB2/NPY 1 cells (e), and GFP1/CR1/CB1/NPY 1 cells (f). Scale bar 5 20 lm in E (applies to A-E). Figure 11. PMID: 26669716.
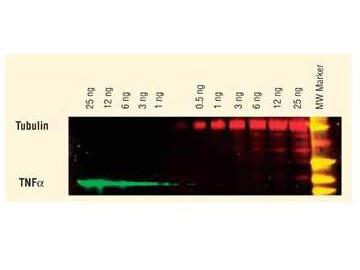
DyLight(TM) dyes can be used for two-color Western Blot detection with low background and high signal. Anti-tubulin was detected using a DyLight(TM) 549 conjugate. Anti-TNFa was detected using a DyLight(TM) 649 conjugate. The image was captured using the Typhoon(TM) 9410 Imaging System.
DyLight(TM) 549 Fluorescence Spectra.
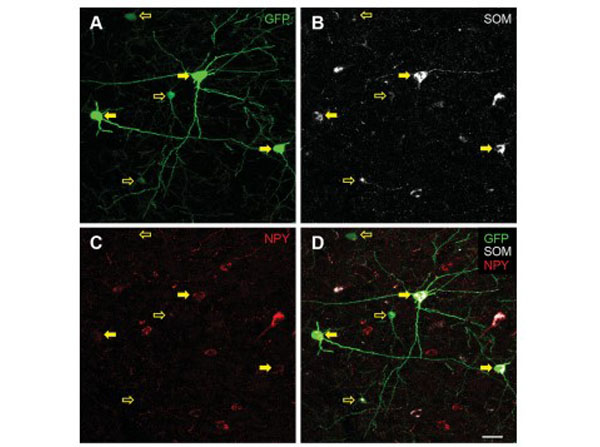
Analysis of neuropeptide Y (NPY) expressing interneurons in the cingulate cortex of FVB-Tg(GadGFP)45704Swn/J mice. A-D: Representative confocal images of cells immunopositive for GFP (green), somatostatin (SOM, white), and NPY (red), and merged image of all channels. Solid yellow arrows indicate GFP1/SOM1/NPY 1 cells and open yellow arrows GFP1/ SOM1/NPY2 cells. E: Mean 6 standard deviation of relative numbers of GFP1/SOM2/NPY2 cells, GFP1/SOM1/NPY2 cells, and GFP1/SOM1/NPY 1 cells in the cingulate cortex. Scale bar 5 20 lm in D (applies to A-D). Figure 10. PMID: 26669716.
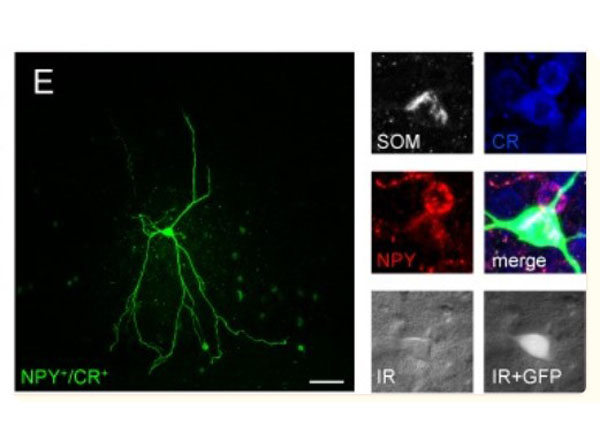
Morphological variety of group I GIN. A-E, left panel Confocal z-stack images as maximum intensity projections of representative group I GIN. Scalebars: 50 µm. Right panel Immunolabeling of biocytin-injected cells for GFP (green), CB (white or blue), CR (white or blue), SOM (white) or NPY (red). Fluorescence (white, GFP) and infrared (IR)-DIC (grey) images of recorded cells were acquired prior recording. Fig 8. PMID: 30001424.
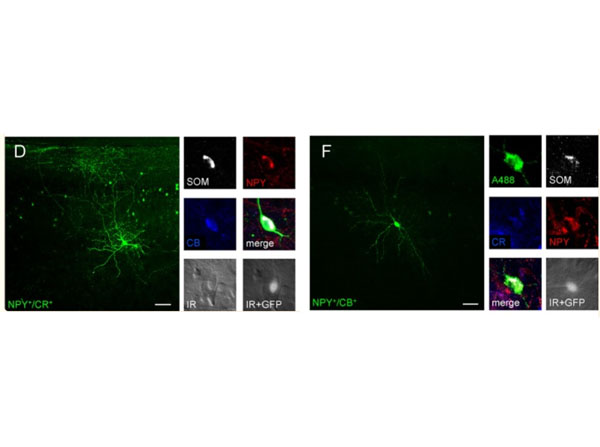
Morphological varieties in group II GIN. Many group I GIN classified as Martinotti cells with massive axonal arborizations in layer 1 and in the home layer. All scalebars: 50 µm. A-F, left panel Confocal Z-stack images of biocytin-injected GIN as maximum intensity projections. Right panel Corresponding immunolabelings of the cells shown in the left panel. Cells were labeled for GFP (green), CR (white or blue), CB (blue or white), SOM (white) or NPY (red). Fluorescence (GFP, white) and infrared-DIC (grey) images were acquired of cells in A-F prior recording. Fig 9. PMID: 30001424.
* Mehrwertsteuer und Versandkosten nicht enthalten. Irrtümer und Preisänderungen vorbehalten