![]()
|
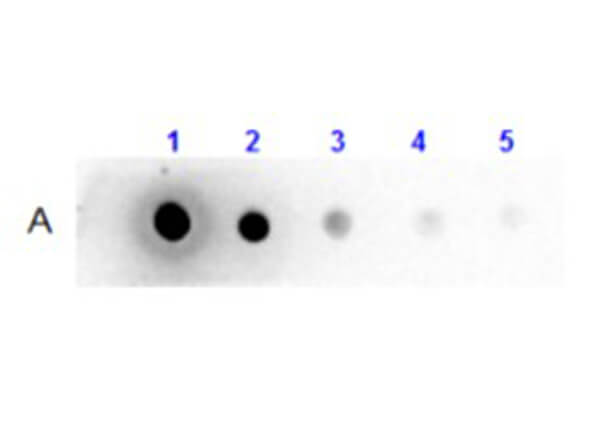
Dot Blot Results of Llama IgG2 Isotype control Biotin Conjugated. Llama IgG2 Isotype control Biotin Conjugate (1) 100ng, (2) 33.33ng, (3) 11.11ng, (4) 3.70ng, (5) 1.23. Antibody: Streptavidin (p/n S000-01) at 1:40,000 for 30 mins at RT. Block: BlockOut (p/n MB-073) for 30 mins at RT. Exposure: 1 sec. |
![]()
|
Streptavidin |
![]()
|
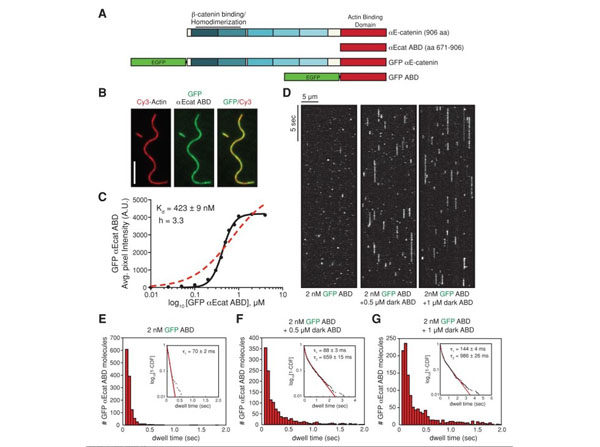
alphaE-catenin ABD binds cooperatively to actin filaments. (A) alphaE-catenin is composed of an array of five four-helix bundles (blue-shaded boxes) and a C-terminal five-helix bundle (red box). The beta-catenin/homodimerization region and actin-binding domain are marked. All alphaE-catenin constructs used in this study are defined. (B) Localization of 1 µM GFP alphaE-catenin ABD bound to phalloidin-stabilized filamentous actin (20% Cy3 labeled). Scale bar, 5 µm. (C) Average fluorescence signal of GFP alphaE-catenin ABD bound to single-actin filaments plotted against total concentration of GFP alphaE-catenin ABD. Each data point represents average GFP fluorescence per pixel measured over 100 µm of single actin filaments (2 TIRF flow chambers). Data were fitted to either a Hill equation (black, straight line) or a hyperbolic function (red, dashed line). (D) Kymographs showing 2 nM GFP alphaE-catenin ABD binding and dissociating from the sides of single actin filaments in the absence or presence of 0.5 or 1 µM dark alphaE-catenin ABD. (E-G) Histograms of 2 nM GFP alphaE-catenin ABD dwell times on filamentous actin in the absence (E) or presence (F) of 0.5 µM dark alphaE-catenin ABD or (G) 1 µM dark alphaE-catenin ABD. Inset, curve fit of the 1-cumulative distribution frequency: (E) single-exponential fit (tau1= 70 2 ms,n= 1244 molecules), (F) double-exponential fit (tau1= 88 3 ms [58%)], tau2= 659 15 ms [42%],n= 1289 molecules), and (G) double-exponential fit (tau1= 144 4 ms [64%], tau2= 986 26 ms [36%],n= 1210 molecules). Streptavidin p/n S000-01). Fig 1. PMID: 24068324. |
![]()
|
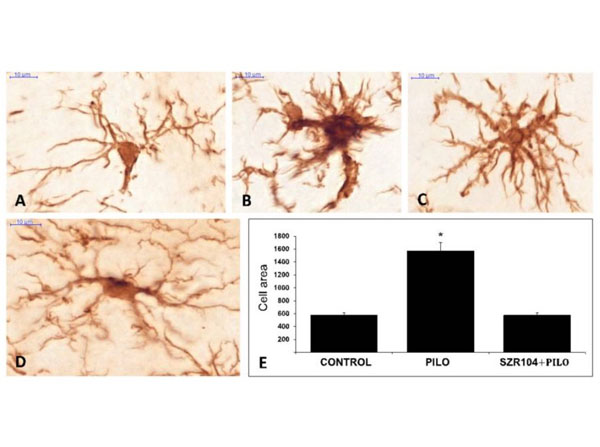
(A-D): ionized calcium-binding adaptor molecule 1 (Iba1)-stained microglia cells from control (A), pilocarpine(PILO)-treated (B,C) and SZR104 + PILO-treated (D) animals. Scale bars: 10 µm. (E): The average microglia cell areas (cell body and processes) in µm2values on the y-axis. Biotinylated secondary antibodies (1:400) and the signal was detected with peroxidase-labeled streptavidin (1:6000) (p/n S000-01). (n =10, mean SEM) in control, PILO-treated and SZR104 + PILO-treated animals (*p 0.05). Fig 3. PMID: 33297593. |
![]()
|
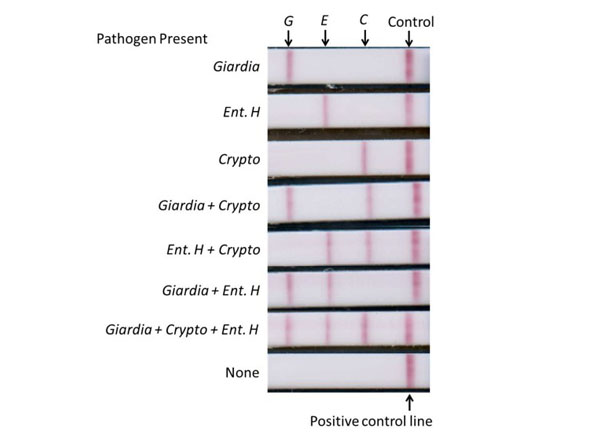
Multiplex lateral flow detection strips with three detection zones and a positive control zone. Strips tested positive(shown from top to bottom) for Giardia, Entamoeba histolytica, Cryptosporidium, Giardia + Cryptosporidium, Entamoeba histolytica + Cryptosporidium, Giardia + Entamoeba histolytica, and Giardia + Cryptosporidium + Entamoeba histolytica, and no pathogens. Streptavidin-coated gold colloid for lateral flow strips (Streptavidin p/n S000-01). Fig 3. PMID: 26669715. |
![]()
|
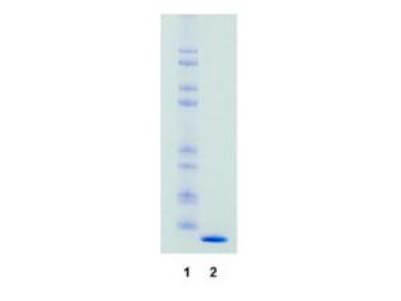
SDS-Page of Streptavidin. Lane 1: Molecular weight markers. Lane 2: Streptavidin. Load: 1.0 ug per lane. Predicted/Observed size: The molecular weight of streptavidin is 55,000 daltons. The protein is composed of 4 essentially identical polypeptide chains (homotetramer). This product is chromatographically pure Streptavidin and shows predominantly a single 13.800 dalton band by SDS-PAGE. |
![]()
|
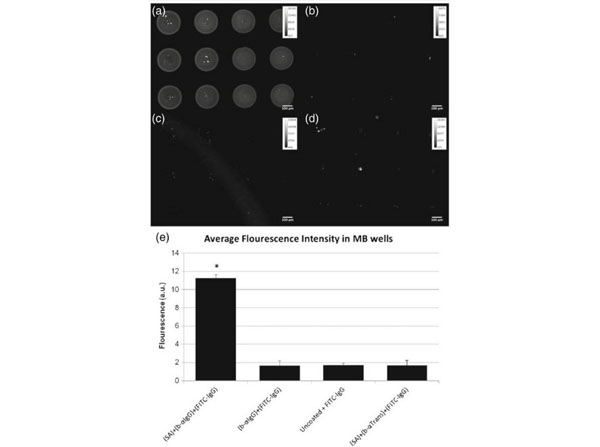
Development of PDMS MB well surface coating to enhance capture cells with affinity for alpha-IgG antibody. FITC-conjugated IgG was added to MB wells coated withastreptavidin + biotinylated alpha-IgG,bbiotinylated alpha-IgG only,cuncoated MBs anddstreptavidin + biotinylated alpha-Transferrin. Quantification of the fluorescent intensity averaged over 12 wells is illustrated in (e). Results indicate that FITC-IgG predominantly binds to the (SA) + b-alpha(IgG) coating.Barsindicate standard error,n=12, *p<0.0001. Streptavidin (p/n S000-01)Fig. 4. PMID: 23358874. |
![]()
|
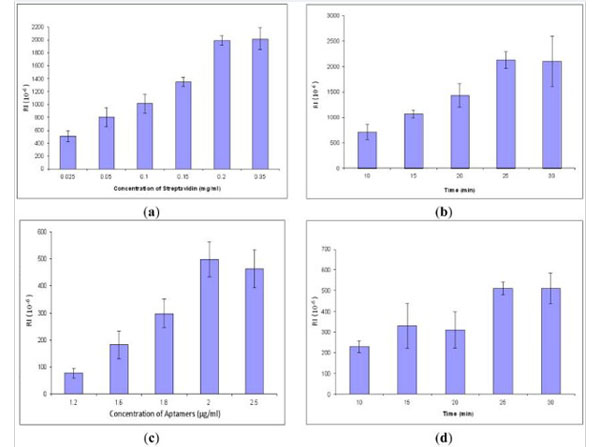
Optimization of streptavidin and aptamers, each concentration and incubation time repeated three times, respectively: (a) Streptavidin concentration, (b) Strept |