Human IgG whole molecule has been tested by SDS-Page and ELISA and can be utilized as a control or standard reagent in Western Blotting, Flow, and ELISA experiments.
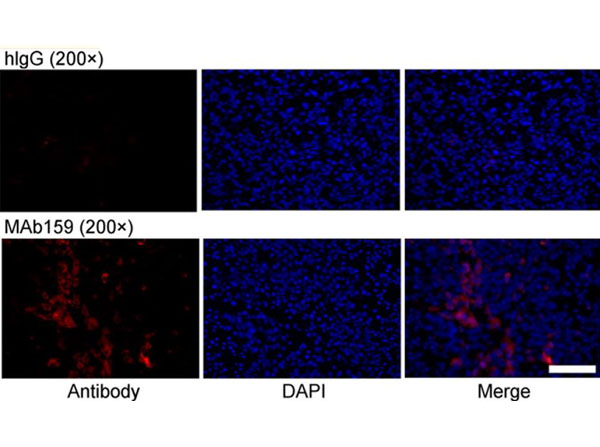
Antibody distribution analysis on BXPC3 tumor sections 48 h after injection of hIgG or MAb159. Scale bar = 100 µm. DAPI 5 4'-6-diamidino-2-phenylindole. Figure 6. PMID: 25908833.
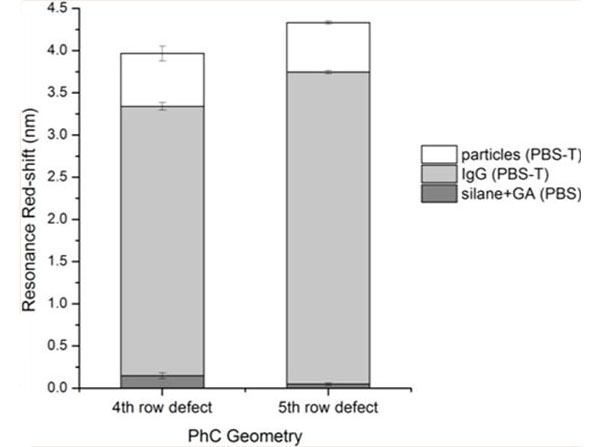
Sensor response to biomolecule functionalization and biomolecule-mediated particle detection. Resonance wavelength shifts were determined for PhC geometries in which the large-defect structure was centered 4 or 5 rows from the W1 waveguide after sequentially exposing the sensors to silane+GA, IgG molecules, and anti-IgG-coupled latex microspheres. The cover medium was either PBS, or PBS with 0.1% Tween-20 (PBS-T), as indicated in the legend. Error bars were calculated as the root-sum-of-squares of the standard deviations of the mean for baseline and experimental measurements. Mean resonance wavelengths and standard deviations were calculated from 5 replicate spectrum scans for all steps except for the particle/PBS-T step, in which only 3 scans each were collected for each PhC to minimize the opportunity for analyte dissociation. Fig 4. PMID: 28357424.
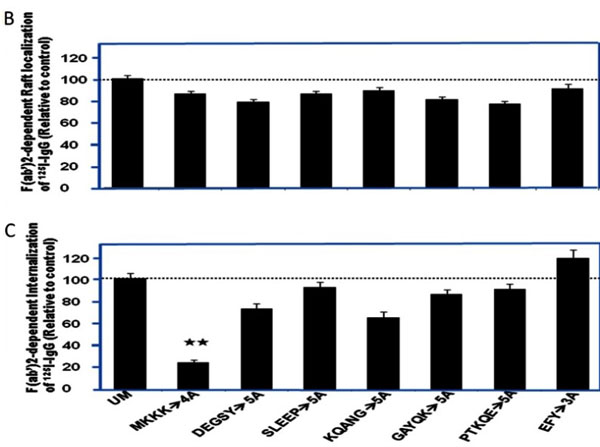
Alanine scanning mutagenesis identifies a single highly conserved juxtamembrane motif, MKKK, in the syndecan-1 cytoplasmic tail as essential for efficient endocytosis after clustering.BandC,raft localization and internalization triggered by clustering. The ligand for FcR-Synd1,125I-labeled nonimmune human IgG, was bound at 4 C to the surface of the McArdle cell lines described inA. Unbound material was washed away, and then the cells were incubated for 1 h at 37 C in the absence or presence of our clustering agent (goat F(ab')2against human IgG Fab). Raft localization was assessed by cold Triton insolubility and internalization by resistance to an acid wash that releases surface-bound IgG. Displayed are clustering-dependent raft localization (B) and internalization of ligand (C), normalized to control values from cells expressing the unmutated chimera (mean S.E.,n= 3). Non-normalized control values were 433.91 26.24 ng/mg that moved into rafts and 416.38 14.15 ng/mg that became internalized (total cell-associated ligand was 850.29 18.2 ng/mg). Thehorizontal dotted linesrepresent the mean values from UM FcR-Synd1-expressing cells.B,p> 0.5 by ANOVA.C, *,p< 0.01 by ANOVA, **,p< 0.01 compared with the UM value by the Dunnett test. The data are representative of a total of three independent catabolism experiments.Fig 1. PMID: 23525115.
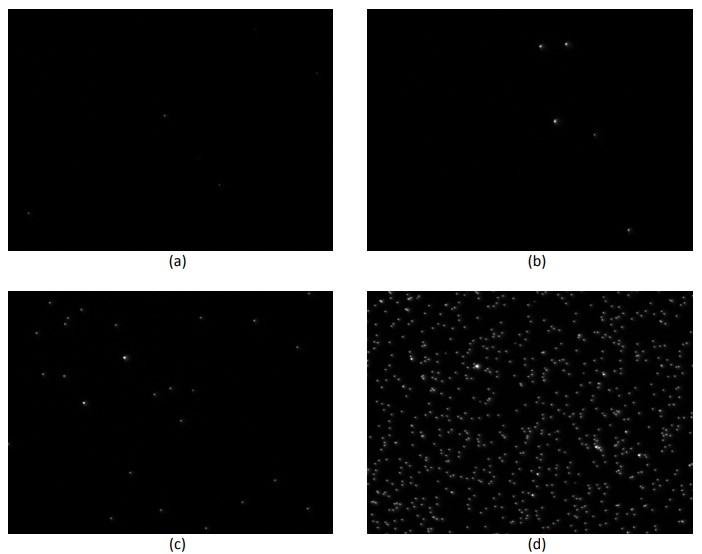
Representative optical microscopy images of the Si/SiO2 chip incubated with 1:100 dilution of human IgG-modified fluorescent latex particle solution along the different steps of surface functionalization. (a) Piranha cleaned chip surface, (b) silane (APDMES) and glutaraldehyde modified surface, (c) silane and glutaralehyde modified chip subsequently blocked with BSA, and (d) silane/GA modified chip functionalized with goat anti-human IgG. All images are at the same exposure. Figure S3. PMID: 28357424.
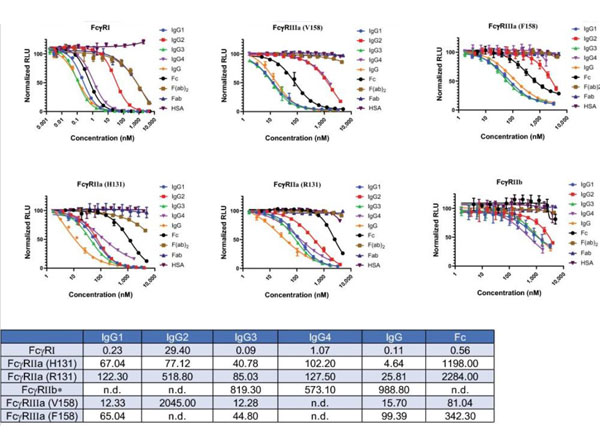
Dose dependent inhibition curves generated with six different FcgammaR assays. Four different set of samples were tested to show the specificity and subclass specific binding. Analytes tested are(1)human IgG subclasses IgG1, IgG2, IgG3, IgG4,(2)human IgG,(3)Fc, Fab, and F(ab)2domains, and(4)human serum albumin (HSA). Data represent the meanstandard error of triplicate experiments. IC50(nM) values calculated from the inhibition curves are shown in the Table. IC50values are in nM. *For FcgammaRIIb IC50values are intended only for qualitative purposes as mentioned in the text.n.d.not determined. Figure 3. PMID: 35842448.
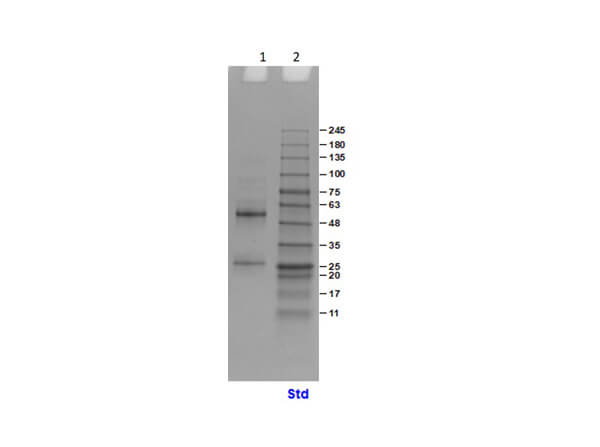
SDS-PAGE of Human IgG. Lane 1: Reduced Human IgG. Lane 2: 5µL OPAL Pre-stained Marker MB-210-0500. Load: 1µg per lane. Predicted/Observed size: Non-reduced at 180-245 kDa , Reduced at 55, 25 kDa.
* VAT and and shipping costs not included. Errors and price changes excepted