Human IgM whole molecule Biotin conjugated, human myeloma IgM whole molecule biotin conjugation
Concentration:
1.0 mg/mL by UV absorbance at 280 nm
Isotype:
IgM
Buffer:
0.02 M Potassium Phosphate, 0.15 M Sodium Chloride, pH 7.2
Source:
Human
Form:
Lyophilized
Application Notes:
Human IgM (myeloma) Biotin conjugated whole molecule can be used as a control or standard in indirect trapping ELISA for quantitation of antigen in serum using a standard curve, for immunoprecipitation and for western blotting.
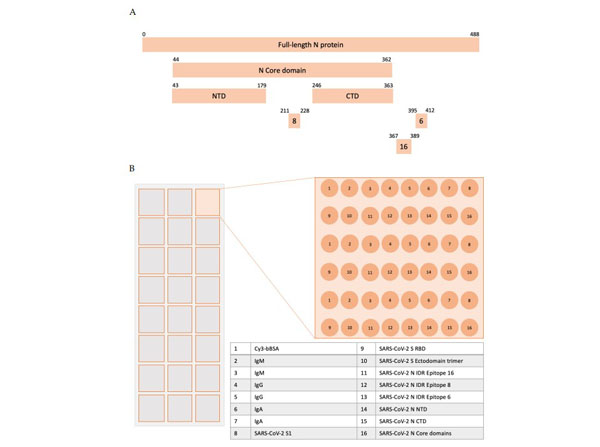
SARS-CoV-2 N protein amino acid coverage on SARS-CoV-2 microarray. (A) Final N protein constructs fabricated on the SARS-CoV-2 microarray, including the full-length protein, core domain (amino acids 44-362), N-terminal domain (NTD) (amino acids 43-179), C-terminal domain (CTD) (amino acids 246-363), peptide 6 (amino acids 395-412), peptide 8 (amino acids 211-228) and peptide 16 (amino acids 367-389). (B) Final microarray layout: 24-plex array with 16 probes (summarized in the Table insert) printed in triplicate. Control antigens used in the microarray included 50 µg/mL of biotinylated human immunoglobulins G, A, and M (hIgG, hIgA, and hIgM, respectively, Rockland, Gilbertsville, PA, USA) and 132 µg/mL of biotinylated anti-human immunoglobulin G (anti-hIgG, Rockland) as well as in house derivatized NHS-ester-Cy3 (Thermo Scientific) biotinylated BSA (Cy3-BSA) at 40 µg/mL. Figure S2. PMID: 33925055.
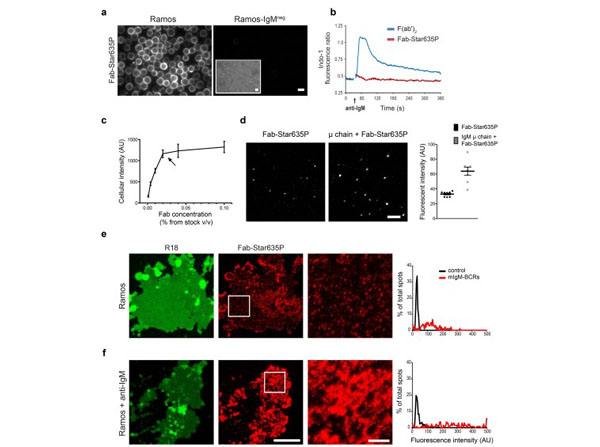
Characterization of a Star635P-conjugated polyclonal antihuman IgM Fab. a Epifluorescence images of wild type and IgM-negative (IgMneg) Ramos B cells stained with a monovalent Star635P-conjugated Fab against human IgM (Fab-Star635P). Fluorescent images were acquired under the same conditions and equally scaled to allow a direct comparison. Transmission light inset in the image on the right-hand side shows the presence of IgMneg cells. Scale bars represent 10 µm. b Ca2+ mobilization analysis of wild type Ramos B cells stimulated (indicated by an arrow) with either polyclonal anti-IgM F(ab)2 (blue curve) or the Star635P-conjugated monovalent anti-IgM Fab (red curve). c Wild type Ramos B cells were stained with increasing concentrations of Fab-Star635P to establish the optimal concentration needed for saturated labeling of mIgM-BCRs on the cell surface. Dilutions ranged from 1:10 (0.1%) to 1:1000 (0.001%) from our stock of fluorescently-labeled Fab. After background correction regions of interest containing whole cells were manually selected and the average intensity of whole cells was calculated. Values represent the average of cellular 6 fluorescence intensities from >50 cells per concentration point. Error bars represent the standard error of the mean. The arrow indicates the final concentration that was used in the experiments shown. d STED images of single Fab-Star635P and Fab-Star635P mixed with a monomeric Ig µ heavy chain seeded on glass coverslips (scale bar 1µm). The bar graph shows the mean fluorescence intensity of single spots and error bars represent the standard error of the mean from eight independent experiments. e, f Confocal images of plasma membrane sheets stained with R18 (pseudocolored in green) and STED images showing the Fab-Star635P fluorescence signal derived from either untreated Ramos B cells (e) or cells that were BCR-activated with a monoclonal anti-IgM antibody (f). Membrane sheets were analyzed as described for Figure 1. Example histograms showing the fluorescence intensity distributions of Fab-Star635Pconjugated on coverslips (black curves, control) and mIgM-spots present in membrane sheets (red curves, mIgM-BCRs). Supplementary Figure 3. PMID: 30778055.
* VAT and and shipping costs not included. Errors and price changes excepted