
Mouse IgG (H&L) Antibody Dylight(TM) 649 Conjugated, Goat, Polyclonal
Catalog Number:
ROC-610-143-002
- Images (9)

| Article Name: | Mouse IgG (H&L) Antibody Dylight(TM) 649 Conjugated, Goat, Polyclonal |
| Biozol Catalog Number: | ROC-610-143-002 |
| Supplier Catalog Number: | 610-143-002 |
| Alternative Catalog Number: | ROC-610-143-002 |
| Manufacturer: | Rockland Immunochemicals |
| Host: | Goat |
| Category: | Antikörper |
| Application: | DOT, WB |
| Species Reactivity: | Mouse |
| Immunogen: | Mouse IgG, whole molecule |
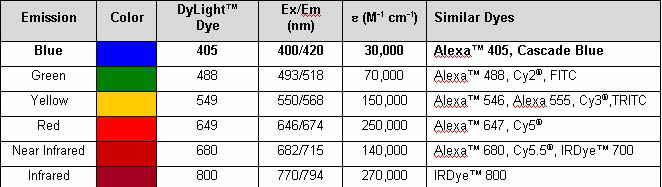
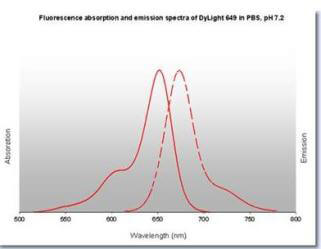
| Conjugation: | DyLight 649 |
| Alternative Names: | Goat Anti-Mouse IgG Secondary Antibody DyLight(TM)649 Conjugated, Goat Anti-Mouse IgG Antibody DyLight(TM)649 Conjugated, Anti-mouse IgG secondary antibody, anti-mouse IgG DyLight(TM)649 conjugated secondary antibody |
| Clonality: | Polyclonal |
| Concentration: | 1.0 mg/mL by UV absorbance at 280 nm |
| Buffer: | 0.02 M Potassium Phosphate, 0.15 M Sodium Chloride, pH 7.2 |
| Form: | Lyophilized |
| Target: | Mouse |
| Antibody Type: | Secondary Antibody |
| Application Dilute: | FLISA: >1:20,000, IF Microscopy: >1:5,000, WB: >1:10,000 |
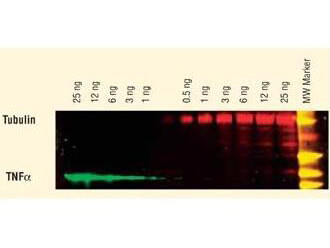
| Application Notes: | Anti-Mouse IgG DyLight 649 Antibody has been tested by dot blot and western blot and is designed for immunofluorescence microscopy, fluorescence based plate assays (FLISA) and fluorescent western blotting. This product is also suitable for multiplex anal |
|
|
|
|
|
|
|
|
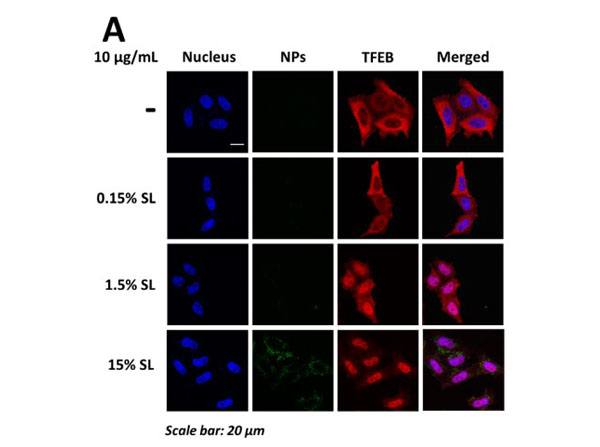
TFEB activation in HeLa/TFEB cells exposed to CPS-SL NPs and SL peptide. A) Confocal microscopy analysis of TFEB nuclear localization in HeLa/TFEB cells treated with CPS and CPS-SL NPs. Representative images show colocalization of the nucleus (blue, Hoechst stain, column 1) and TFEB (red, anti-FLAG, column 2) in merged images (column 3). B) Average fraction of HeLa/TFEB cells untreated and treated with 2-hydroxypropyl-beta-cyclodextrin (CD, 5 mM) and SL peptide (1.5 and 7.5 µg/mL, 24 h) that present nuclear localization of TFEB. Data reported as mean SD (n 3). C) Average fraction of TFEB that localizes to the nucleus of HeLa/TFEB cells treated as in B. Data reported as mean SD (n 3). Figure S3. PMID: 31268689. |
|
|
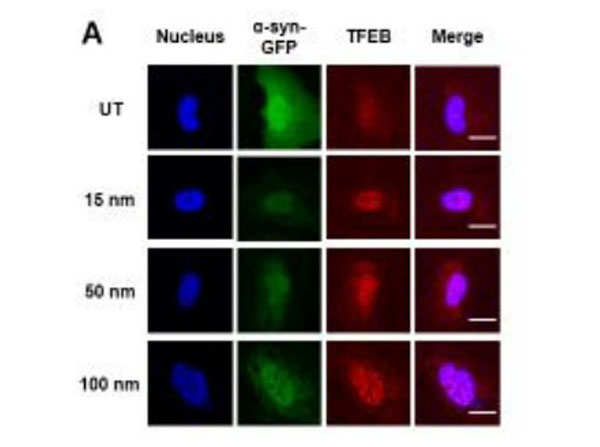
Accumulation of autophagic substrates in H4/ alpha-syn-GFP cells exposed to TiO2 NPs. (A) Confocal microscopy analyses of TFEB subcellular localization in H4/alpha-syn-GFP cells transfected with TFEB-3XFLAG and incubated with TiO2 NPs (100 µg/mL, 24 hrs). Representative images of colocalization of nuclei (blue, Hoechst stain, column 1) and TFEB (red, anti-TFEB, column 3) is shown in merged images (column 4). Scale bar is 20 µm. (B) Quantification of LC3-II/LC3-I levels in the soluble protein fraction of H4/alpha-syn-GFP cells treated with TiO2 NPs (100 µg/mL, 24 or 72 hrs) measured by Western blot. Data presented as mean s.d. *p<0.01. Figure 6. PMID: 30134208. |
|
|
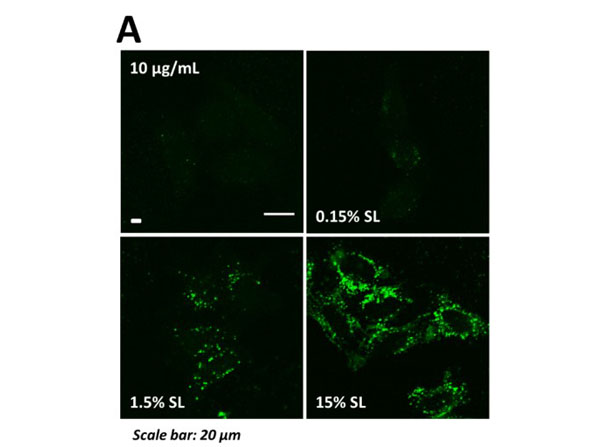
Uptake of CPS-SL and CPS-SA NPs in HeLa/TFEB cells, HeLa cells and fibroblasts. A) Representative confocal microscopy images of nanoparticle internalization in HeLa/TFEB cells treated with fluorescent CPS NPs and CPS-SL NPs. BC) Average fluorescence of B) HeLa/TFEB and BC) HeLa cells treated with fluorescent CPS-SA NPs containing 1.5% SA ( B) 10 and 50 µg/mL, C) normalized treatment concentration, 24 h) normalized to the average fluorescence of cells treated with B) 10 µg/mL or C) 50 µg/mL CPS NPs. Data reported as mean SD (n 3). D) Average fluorescence of fibroblasts treated with fluorescent CPS NPs and CPS-SL NPs (at concentrations that result in comparable uptake) normalized to the average fluorescence of cells treated with 50 µg/mL CPS NPs. Data reported as mean SD (n 3). Figure S5. PMID: 31268689. |
|
|
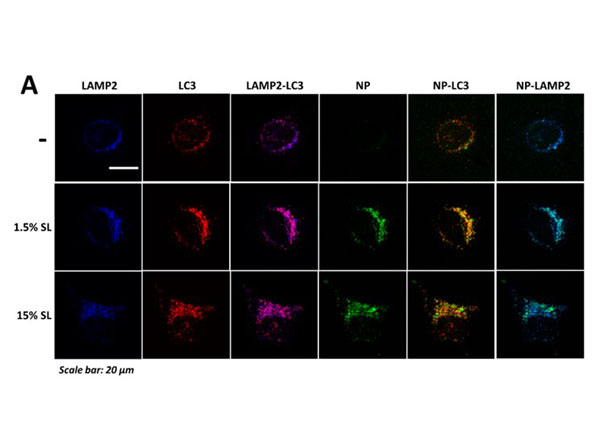
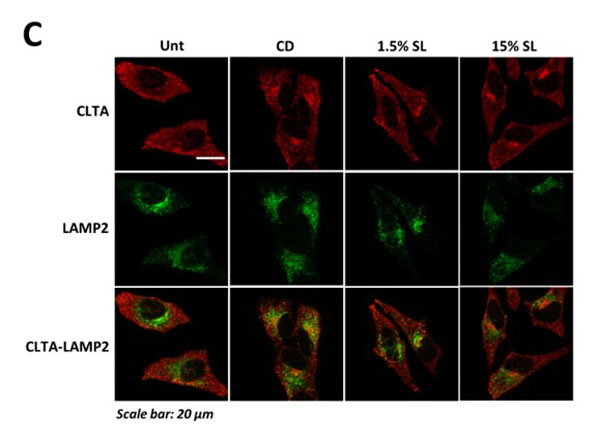
Co-localization of LC3, LAMP2, and nanoparticle aggregates, analysis of autolysosome formation, and co-localization of CLTA and LAMP2 in HeLa cells exposed to CPS-SL NPs and SL peptide. A) Confocal microscopy analyses of LC3 puncta, LAMP-LC3 colocalization, nanoparticle aggregates, NP-LC3 colocalization, and NP-LAMP colocalization in HeLa cells treated with fluorescent CPS NPs and CPS-SL NPs (normalized treatment concentrations, 24 h). Representative images show LAMP (blue, anti-LAMP-2, column 1), LC3 puncta (red, anti-LC3, column 2), the colocalization of LAMP with LC3 (column 4, merged images), intracellular nanoparticle aggregates (green, fluorescent NPs, column 4), the colocalization of nanoparticle aggregates with LC3 (column 5, merged images), and the colocalization of nanoparticle aggregates with and LAMP (column 6, merged images). B) Average number of LC3 puncta per cell and colocalization of LAMP2 with LC3 in HeLa cells, untreated, and treated with 2-hydroxypropyl-beta-cyclodextrin (CD, 5 mM), and SL peptide (1.5 and 7.5 µg/mL, 24 h) C) Confocal microscopy analyses of CLTA-LAMP colocalization in HeLa cells treated with cyclodextrin (CD, 5mM, 24h) and fluorescent CPS NPs and CPS-SL NPs (normalized treatment concentrations, 24 h). Representative images show CLTA (red, anti-CLTA, row 1), LAMP (green, anti-LAMP2, row 2), and the colocalization of CLTA with LAMP (row 3, merged images). Figure S7. PMID: 31268689. |
|
|
Co-localization of LC3, LAMP2, and nanoparticle aggregates, analysis of autolysosome formation, and co-localization of CLTA and LAMP2 in HeLa cells exposed to CPS-SL NPs and SL peptide. A) Confocal microscopy analyses of LC3 puncta, LAMP-LC3 colocalization, nanoparticle aggregates, NP-LC3 colocalization, and NP-LAMP colocalization in HeLa cells treat |
|
|
|
|
|
Product Guarantee and Expert Support
