![]()
|
|
![]()
|
|
![]()
|
Bovine Serum Albumin - Fraction V |
![]()
|
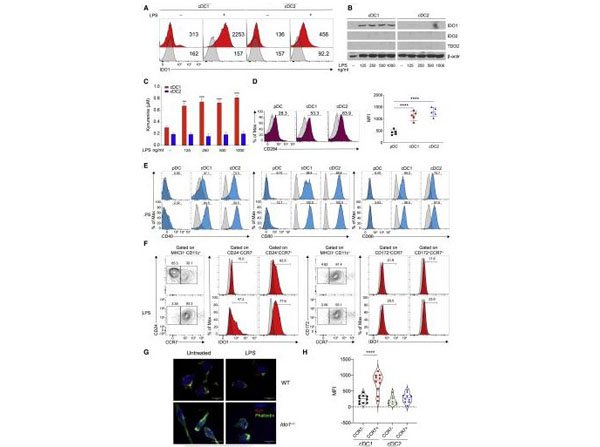
IDO1 is selectively induced in cDC1 cells following LPS stimulation(A) IDO1 expression was analyzed by IS in BMDCs (n= 5).(B) Immunoblot analysis was carried out for IDO1, IDO2, TDO2, and beta-actin expression (n= 3).(C) Supernatants from cells prepared as in (B)were analyzed forl-kynurenine content by HLPC.(D and E) Flow plot (left) and quantification (right) of CD284 (D), and flow plot of CD40, CD80, and CD86 (E)on DC subsets (n= 3).(F) BM-derived cDC1 and cDC2 were treated as in (B)and IDO1 expression evaluated in CCR7-and CCR7+populations treated as in (B), pre-gated on cDC1 and cDC2 (n= 3).(G) Immunofluorescence analysis ofl-kynurenine expression in sorted CCR7+cDC1 of different genotypes treated as in (B) (n= 3).(H) IDO1 expression (MFI) in thymic CCR7-and CCR7+dendritic cell subsets, gated on CD11c+MHCII+XCRI+CD117-and CD11c+MCHII+CD172+CD117-(n= 3).Data are shown as mean SD.**p<0.01,***p<0.001,****p<0.0001, one-way (D and H) or two-way (C) ANOVA followed by Bonferroni multiple comparison test. Isotype control as gray histogram. Figure1. PMID: 35704993. |
![]()
|
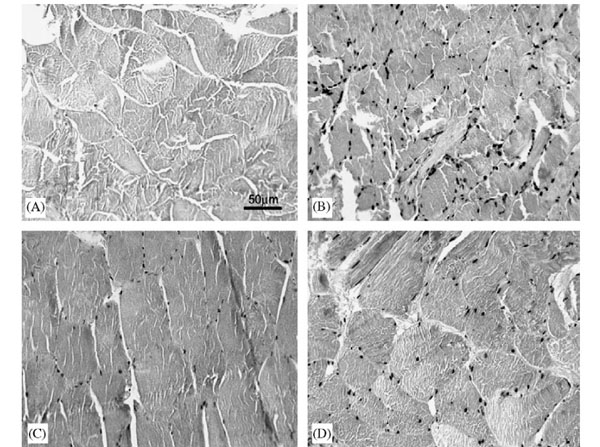
(I) Immunostaining for 8OhdG: (A) negative control, (B) muscle from subject 465 yr (positive control), (C) muscle from weight maintainer, and (D) muscle from weight gainer.For the 8OHdG assay, samples were treated with 10 mg/ml Proteinase K in phosphate-buffered saline (PBS) (0.05 M phosphate, 0.15 M NaCl, pH 7.4) with 1% bovine serum albumin (p/n BSA-50) for 40 min at 37 1C, and incubated in 5% skim milk in PBS for 2 h. Figure 1. PMID: 16687193. |
![]()
|
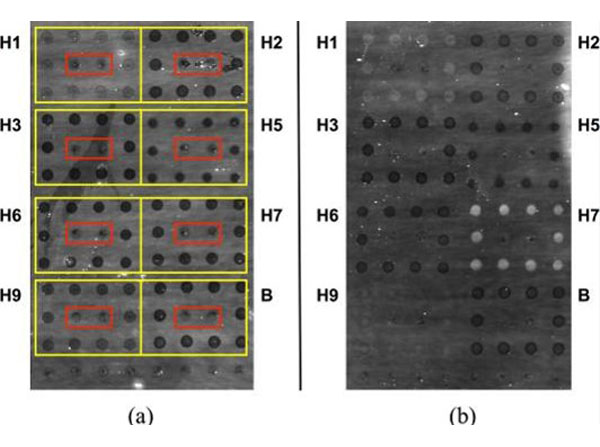
Strong responses to polyclonal anti-HA antiserum are readily observable on an AIR hemagglutinin microarray.(a) 1% BSA control (p/n BSA-10). (b) Anti-H7 polyclonal antiserum (A/Netherlands/219/2003, H7N7), 1:80 dilution (1.3%) in 1% BSA. Spots showing substantially increased brightness indicate binding to immobilized H7. In both cases, antigens were arrayed in square patterns as indicated by the yellow boxes in (a), a mouse IgG Fc domain (p/n 010-0103) was included as negative control (red boxes). Slight differences in spot intensity in the control (a) are due to differences in deposition efficiency for different antigens or controls. Specific antigens used in these experiments are indicated inTable 2. Goat anti-fluorescein, (p/n 600-101-096) used as an internal negative control.Fig 1. PMID: 26241048. |
![]()
|
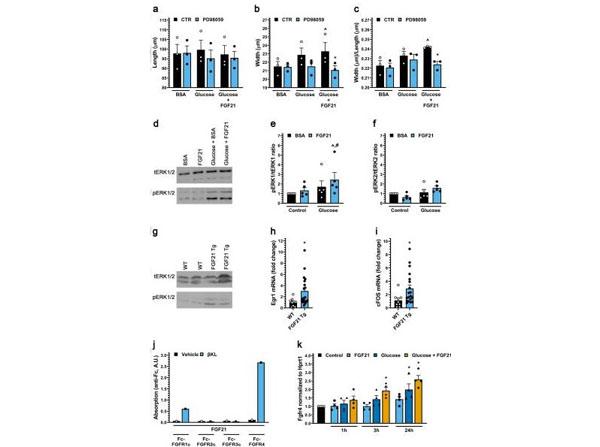
FGF21 activates ERK1/2 in cultured cardiac myocytes in the presence of high glucose and in heart tissue of mice. (a-c) Length, width and width to length ratio for ARVMs treated with BSA (control), FGF21 (25ng/ml), increased glucose and/or the MEK inhibitor PD98059 (20µM) for 48h. Bars and colored symbols indicate average mean and means of independent experiments using different myocyte preparations, respectively. (d-f) Western blot analysis of ARVMs treated with BSA (control) or mouse recombinant FGF21 (25ng/ml) with or without 10mM glucose for 6h. ERK1 is p44 and ERK2 is p42. (g) Analysis of cardiac tissue from FGF21 Tg mice and wild-type littermates at 8-12weeks of age by Western blotting. (h,i) qRT-PCR forEgr-1andc-FosmRNA using total RNA from heart tissue of FGF21 Tg mice and wild-type littermates at 8-12weeks of age. (j) Binding of 1µg of soluble beta-klotho (betaKL) or PBS, 500ng of Fc-tagged FGFR 1c, 2c, 3c, or 4 to 96-well plates coated with 200ng of FGF21. (k) qRT-PCR forFGFR4mRNA using total RNA isolated from ARVMs treated with BSA (control), FGF21 (25ng/ml), and/or increased glucose (15.6mM total). Comparison between groups was performed in form of a one-way (a-c,k) or two-way (e-f) ANOVA followed by post-hoc Tukey testor a two tailed t-test (h,i). All values are expressed as meanSEM. (a-c) N=3, p0.05 vs. BSA CTR, *p0.05 vs. Glucose+FGF21 CTR, (e,f) N=5, p0.05 vs. BSA CTR,p0.05 vs. FGF21 CTR, (h, i) N=9-19, *p0.05 vs. WT,(k) N=4, *p0.05 vs. CTR. All Western blots are cropped, and original |