Protein G Biotin Conjugated is suitable as a detection agent for primary antibodies that are of the IgG isotype.
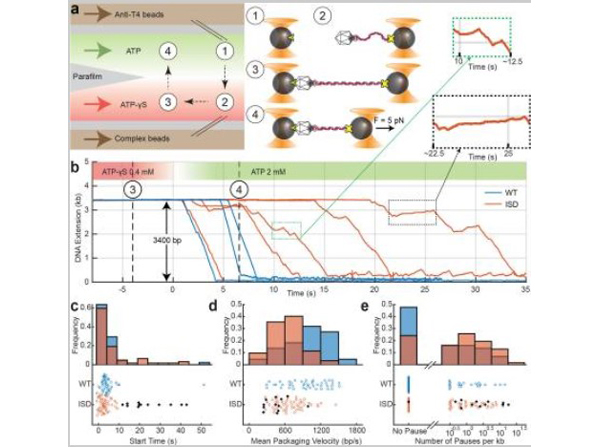
Motors containing inactive subunits exhibit slower start times, lower packaging speeds, and more pausing. aSchematic of the optical trapping assay to measure the packaging dynamics of a single T4 motor. A multi-stream laminar flow chamber (left) is used to manipulate samples and buffer. A bead coated with anti-T4 antibodies is captured in one trap in a flow stream containing ATP (green stream, step ). Another bead conjugated with arrested T4 capsid-gp17-DNA motors is captured in a second optical trap in the stream containing non-hydrolyzable analog ATP-gammaS (red stream, step ②). The motor bound to DNA in the presence of ATP-gammaS cannot initiate packaging due to a lack of energy source. To form a tether between the bead pair, the beads are moved close for 1s and separated apart to detect binding of capsid to antibody (step 3). After a constant force (F=5pN) load is applied to the tether, the traps are moved into ATP and packaging is detected as the decrease of DNA extension when DNA is translocated into the capsid by the motor (step ④).bExtension of unpackaged DNA vs. time, under constant force load. Packaging activity is observed within seconds of entering the ATP stream. Representative packaging trajectories with WT (blue) and ISD motors (orange) are shown.cDistribution of the start times of WT (blue,n=44) and ISD motors (orange,n=62), defined as the dwell time between entry into the ATP stream and the start of packaging.dDistribution of mean pause-free packaging velocity derived from each packaging trace. ISD motors (orange) show a lower packaging velocity than WT motors (blue).eHistogram of the logarithm of pause frequency, defined as the number of pauses per kb packaged. ISD motors (orange) exhibit more pauses than WT motors (blue) on average. Motors with long start times (black stars,c-e) have a lower packaging velocity and higher pause frequency. The number of trajectories used is indicated byn=. Fig 4. PMID: 34772936.
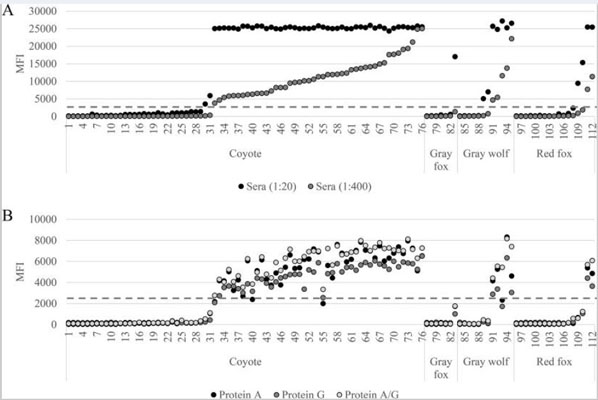
Signal response of Nobuto serum samples from 112 canids profiled with the F1-LPA. (A) Detection of F1 immunoreactivity was accomplished using a genus-specific secondary anti-IgG antibody. (B) Detection of F1 immunoreactivity was accomplished using biotinylated conjugates of staphylococcal protein A (p/n PA00-06), streptococcal protein G (p/n PG00-06), and staphylococcal protein A and streptococcal protein G (A/G), with sera diluted 1:20. The dashed line indicates the threshold for positive and negative samples using an S/N ratio of 10. FIG 2. PMID: 29695520.
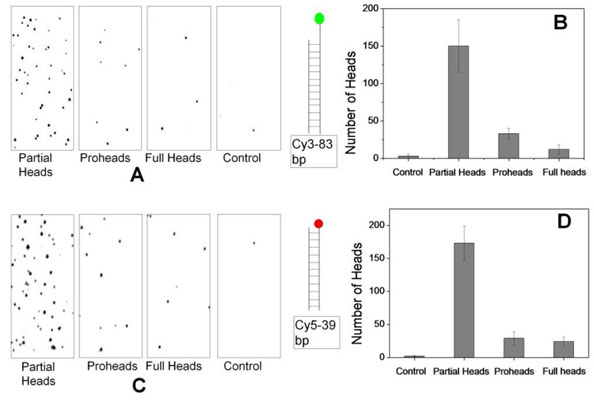
Single molecule fluorescence measurements of refilled heads. Quantification of packaging by single molecule fluorescence assay. (A and C) Fluorescence images of immobilized T4 heads packaged with Cy3 (83-bp) and Cy5 (39-bp) DNAs, respectively. One-fourth of the 70 µm *35 µm imaging area is shown in each case. (B and D) Histograms showing the number of heads packaged with Cy3 or Cy5 DNAs. The number of heads showing fluorescence in more than 30 images was averaged in each case. Figure 6. PMID: 21358801.
* VAT and and shipping costs not included. Errors and price changes excepted